1Not a wave but a tsunami
A Democratic takeover of the House was widely expected before the vote. What surprised markets was not the direction but the size, and as counting went on, talk of a "blue wave" turned into talk of a "blue tsunami".
As of the afternoon of November 6, AP tallies gave Democrats 253 of the 435 House seats and Republicans 162. With 20 races still uncalled, Democrats were already 39 seats above their 214 in the outgoing House and on track for their largest majority since 2008 (257). In the Senate, seven seats flipped, turning a 53–47 Republican edge into 54 Democrats and 44 Republicans, with Alaska and Mississippi still too close to call by a few hundred to a few thousand votes.
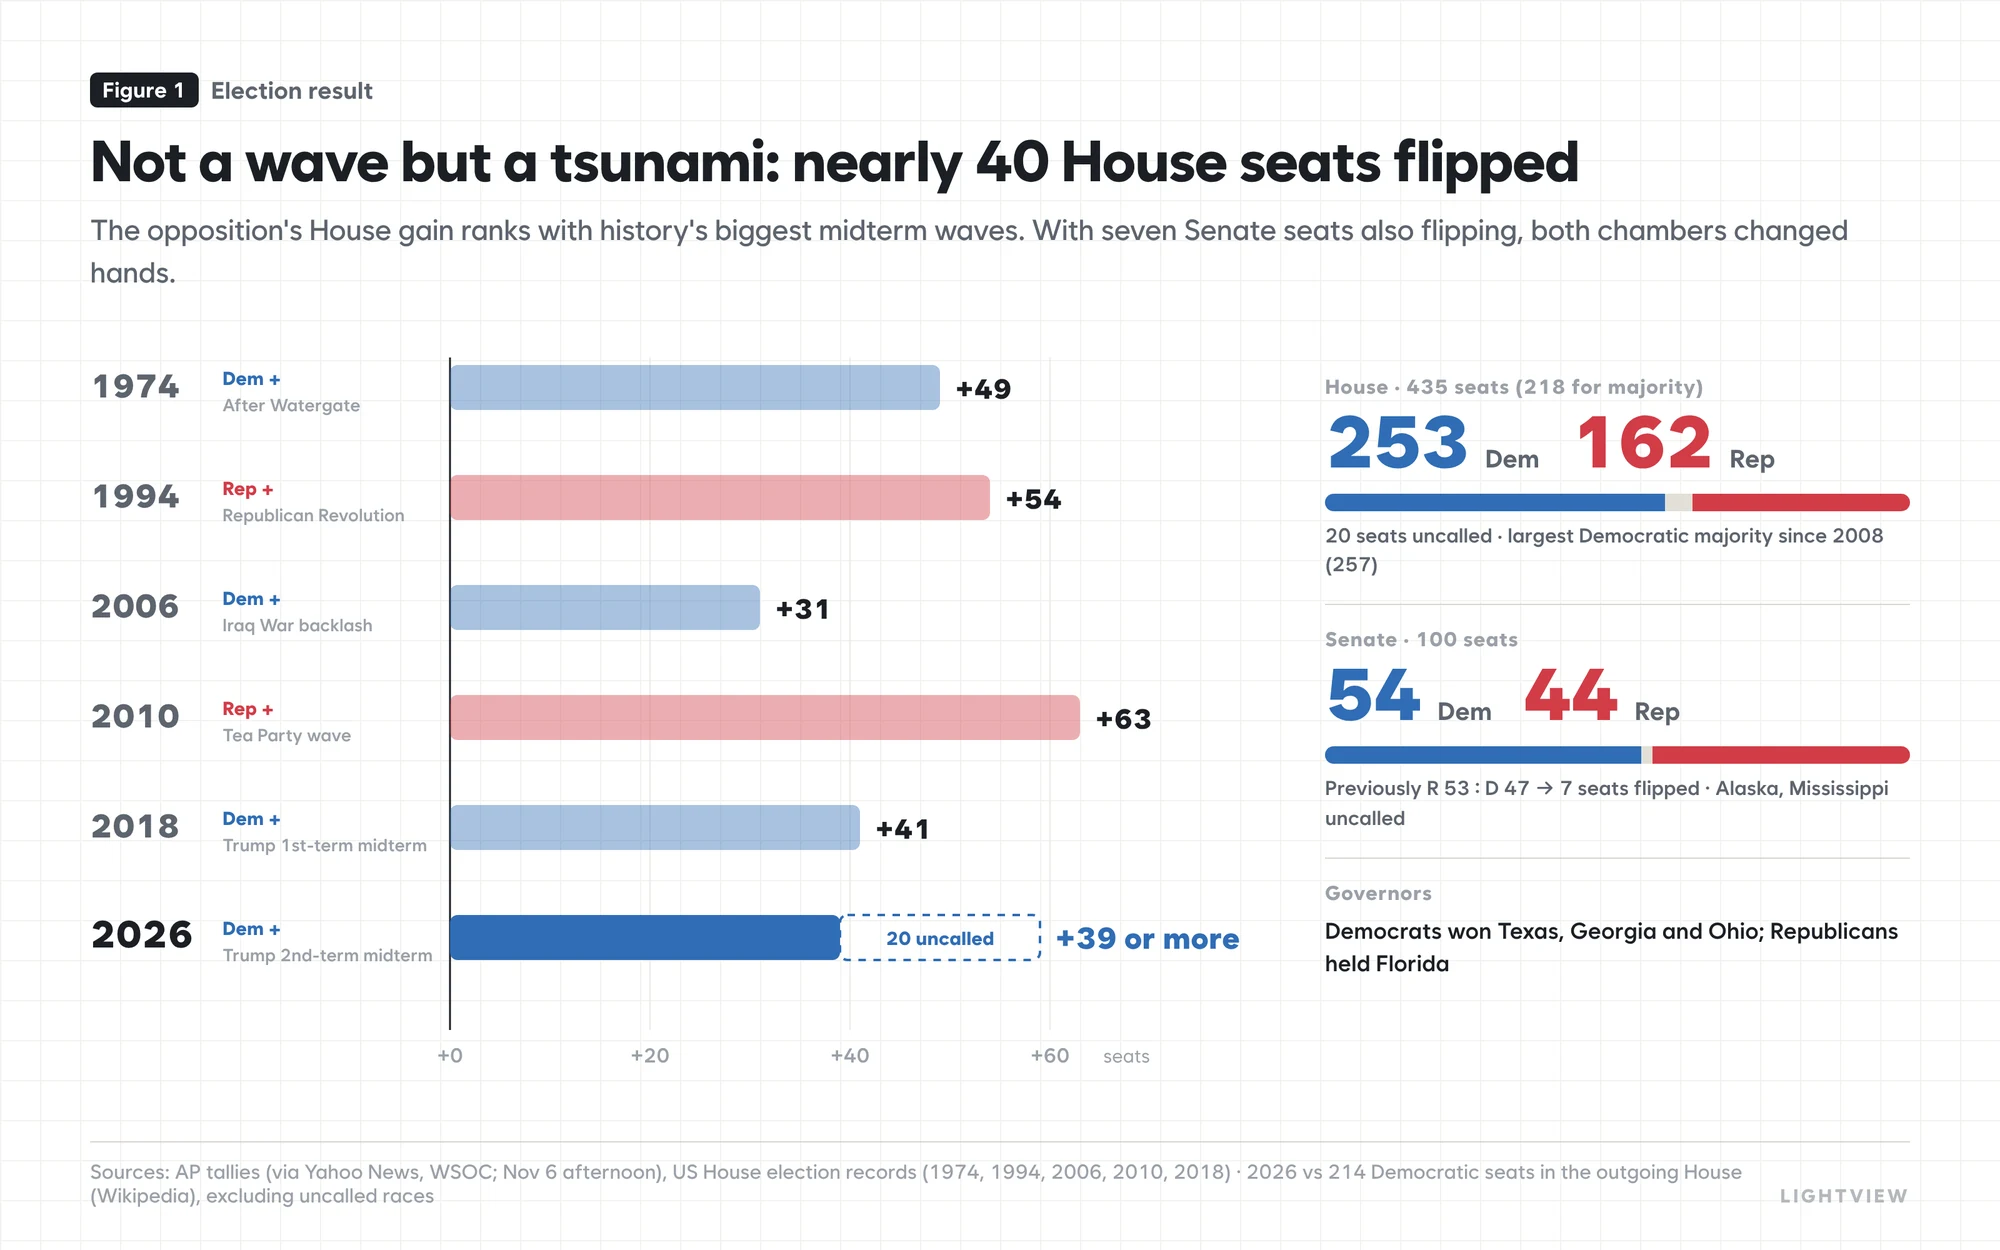
Set against past midterms, the scale becomes clearer. In House terms it is in the same league as the 1994 Republican Revolution (+54) and the 2010 Tea Party wave (+63), and already matches or exceeds the Democratic wins of 2006 (+31) and 2018 (+41). Democrats also won governor's races in Texas, Georgia and Ohio; Texas in particular ties directly into the data-center story that follows.
For investors, what matters is less who won than what changes. With the president unchanged, policies the executive can set alone, such as tariffs, are unlikely to shift much. But anything that needs Congress, from budgets and the debt ceiling to extending tax credits, now requires agreement between the parties. The next three days showed how markets read that change.
2One day of cheers, one day of selling
The first reaction on November 4 was relief. A lopsided result cleared up uncertainty over the count quickly, and the view gained ground that divided government makes extreme policy less likely.
The Dow rose 3.0% that day, its biggest post-midterm gain since 1982, while the S&P 500 and Nasdaq added 1.6% and 1.4%. The VIX fell to 16.6, a sign that markets had exhaled. The mood flipped within a day: on November 5 the S&P 500 dropped 4.4%, its largest one-day fall since April 2025, while the Nasdaq-100 lost 6.4% and the chip ETF (SMH) 11.2%.
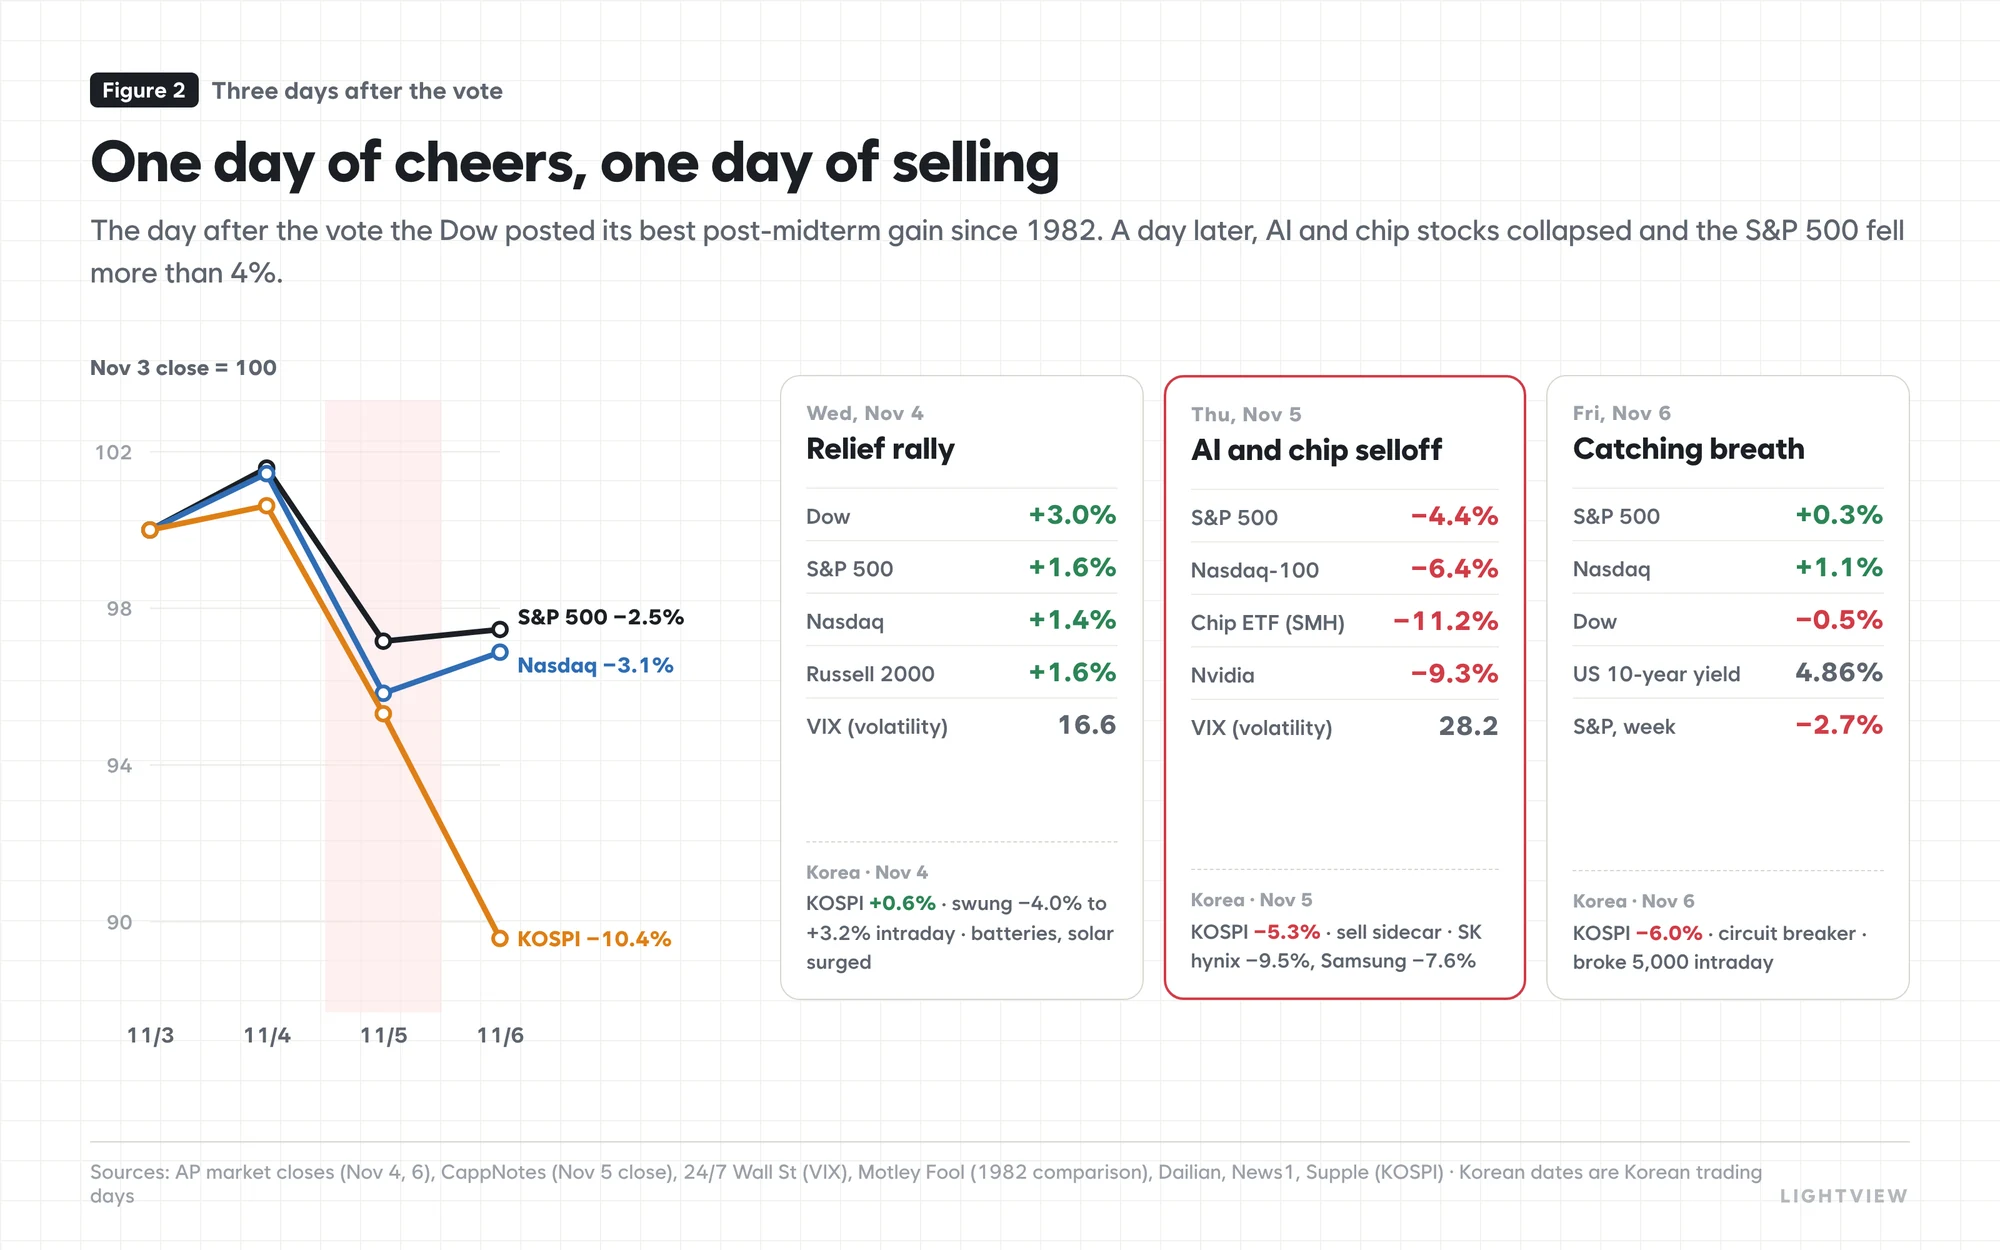
The shock in Korea was bigger. After swinging widely on November 4, the KOSPI fell 5.3% on the 5th and 6.0% on the 6th, triggering sell sidecars on both days and a circuit breaker on the 6th, when it briefly fell to 4,911, below 5,000. SK hynix and Samsung Electronics dropped 9.5% and 7.6% on the 5th, showing how pressure on US chip stocks passed straight through to a market heavily weighted toward memory exports.
Over the three days the S&P 500 lost 2.5% and the Nasdaq 3.1%, but the KOSPI fell more than 10%. The key to that gap lies in how differently individual sectors reacted to the same election.
Those who use AI, and those who build it
Laying out November 4 sector by sector shows that markets parsed the result in some detail. Hopes that clean-energy tax credits and health coverage might be restored lifted Enphase (+8.8%), First Solar (+8.4%) and hospital operator HCA (+8.5%), and in Korea solar and battery names such as Hanwha Solutions (+18.6%) and Samsung SDI (+11.6%) surged.
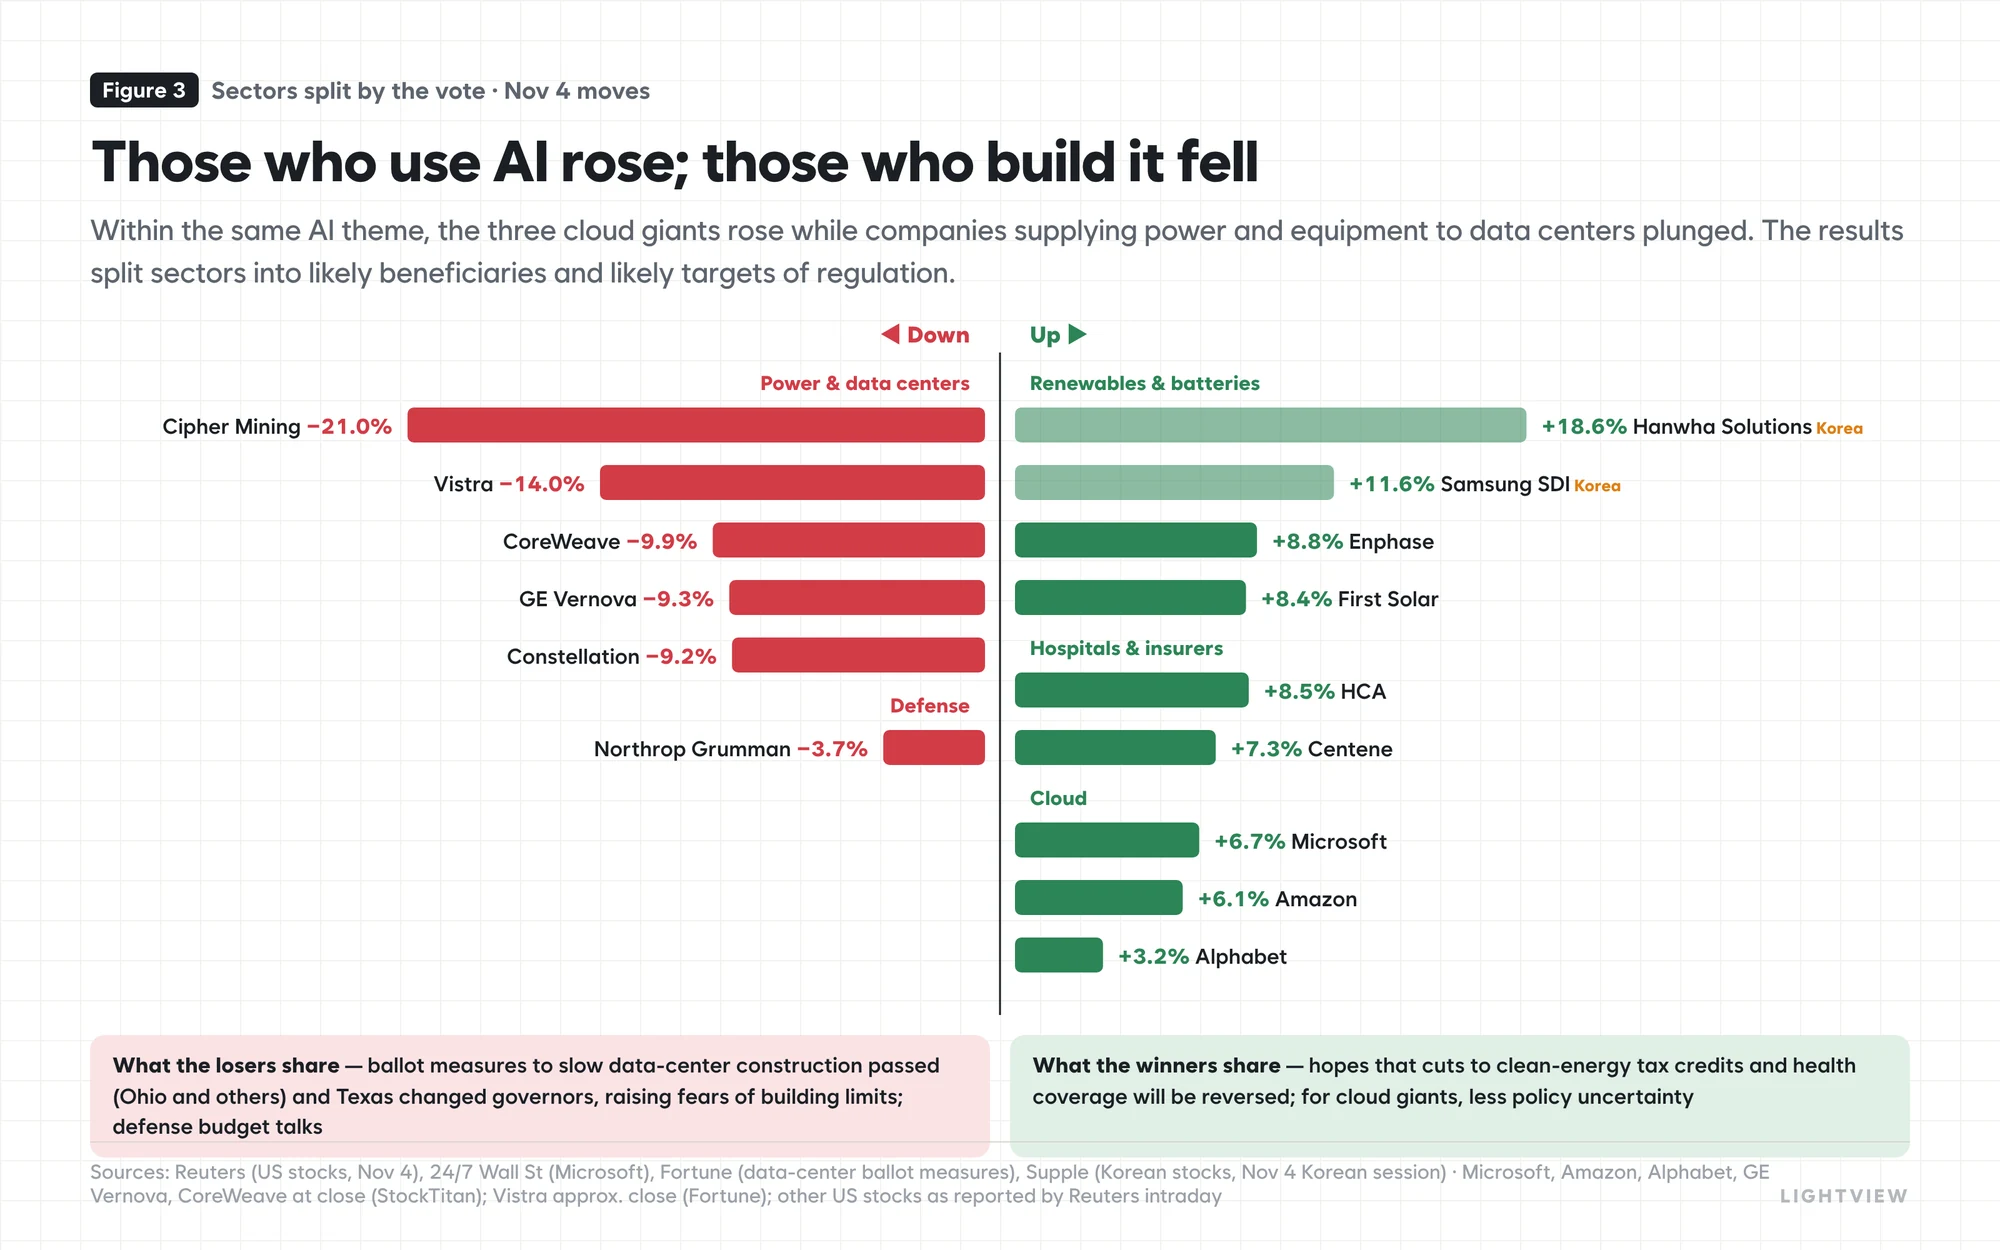
What stands out is the split within the AI theme. The cloud giants that use AI, Microsoft, Amazon and Alphabet, rose 3–7%, while the companies that supply power and equipment to data centers, Vistra (about −14%), CoreWeave (−9.9%) and GE Vernova (−9.3%), fell sharply. The immediate triggers were ballot measures in Ohio and elsewhere to slow data-center construction, and a change of governor in Texas, home to 27% of planned data-center power capacity (Wells Fargo estimate). State and local results were priced in before anything in Congress.
In other words, markets priced in the risk of a brake on how fast AI infrastructure gets built before any doubt about AI demand itself. A day later, that worry spread to chips as a whole.
3November 5: why AI broke
It is hard to pin the November 5 rout, which erased roughly $3 trillion of market value in a day, on the election alone. The vote looks more like the trigger, with the ammunition built up well before.
The first strand is political. Goldman Sachs estimates that about 45% of planned US data-center capacity could face state and local building limits (while noting these are likely to be short-lived), meaning that the chain from more data centers to more chip and power-equipment orders has, for the first time, come within reach of politics. The second is positioning: hedge funds sold tech in the week to October 15 at the fastest pace in at least a decade, and their net leverage had fallen to a one-year low of 48.6%.
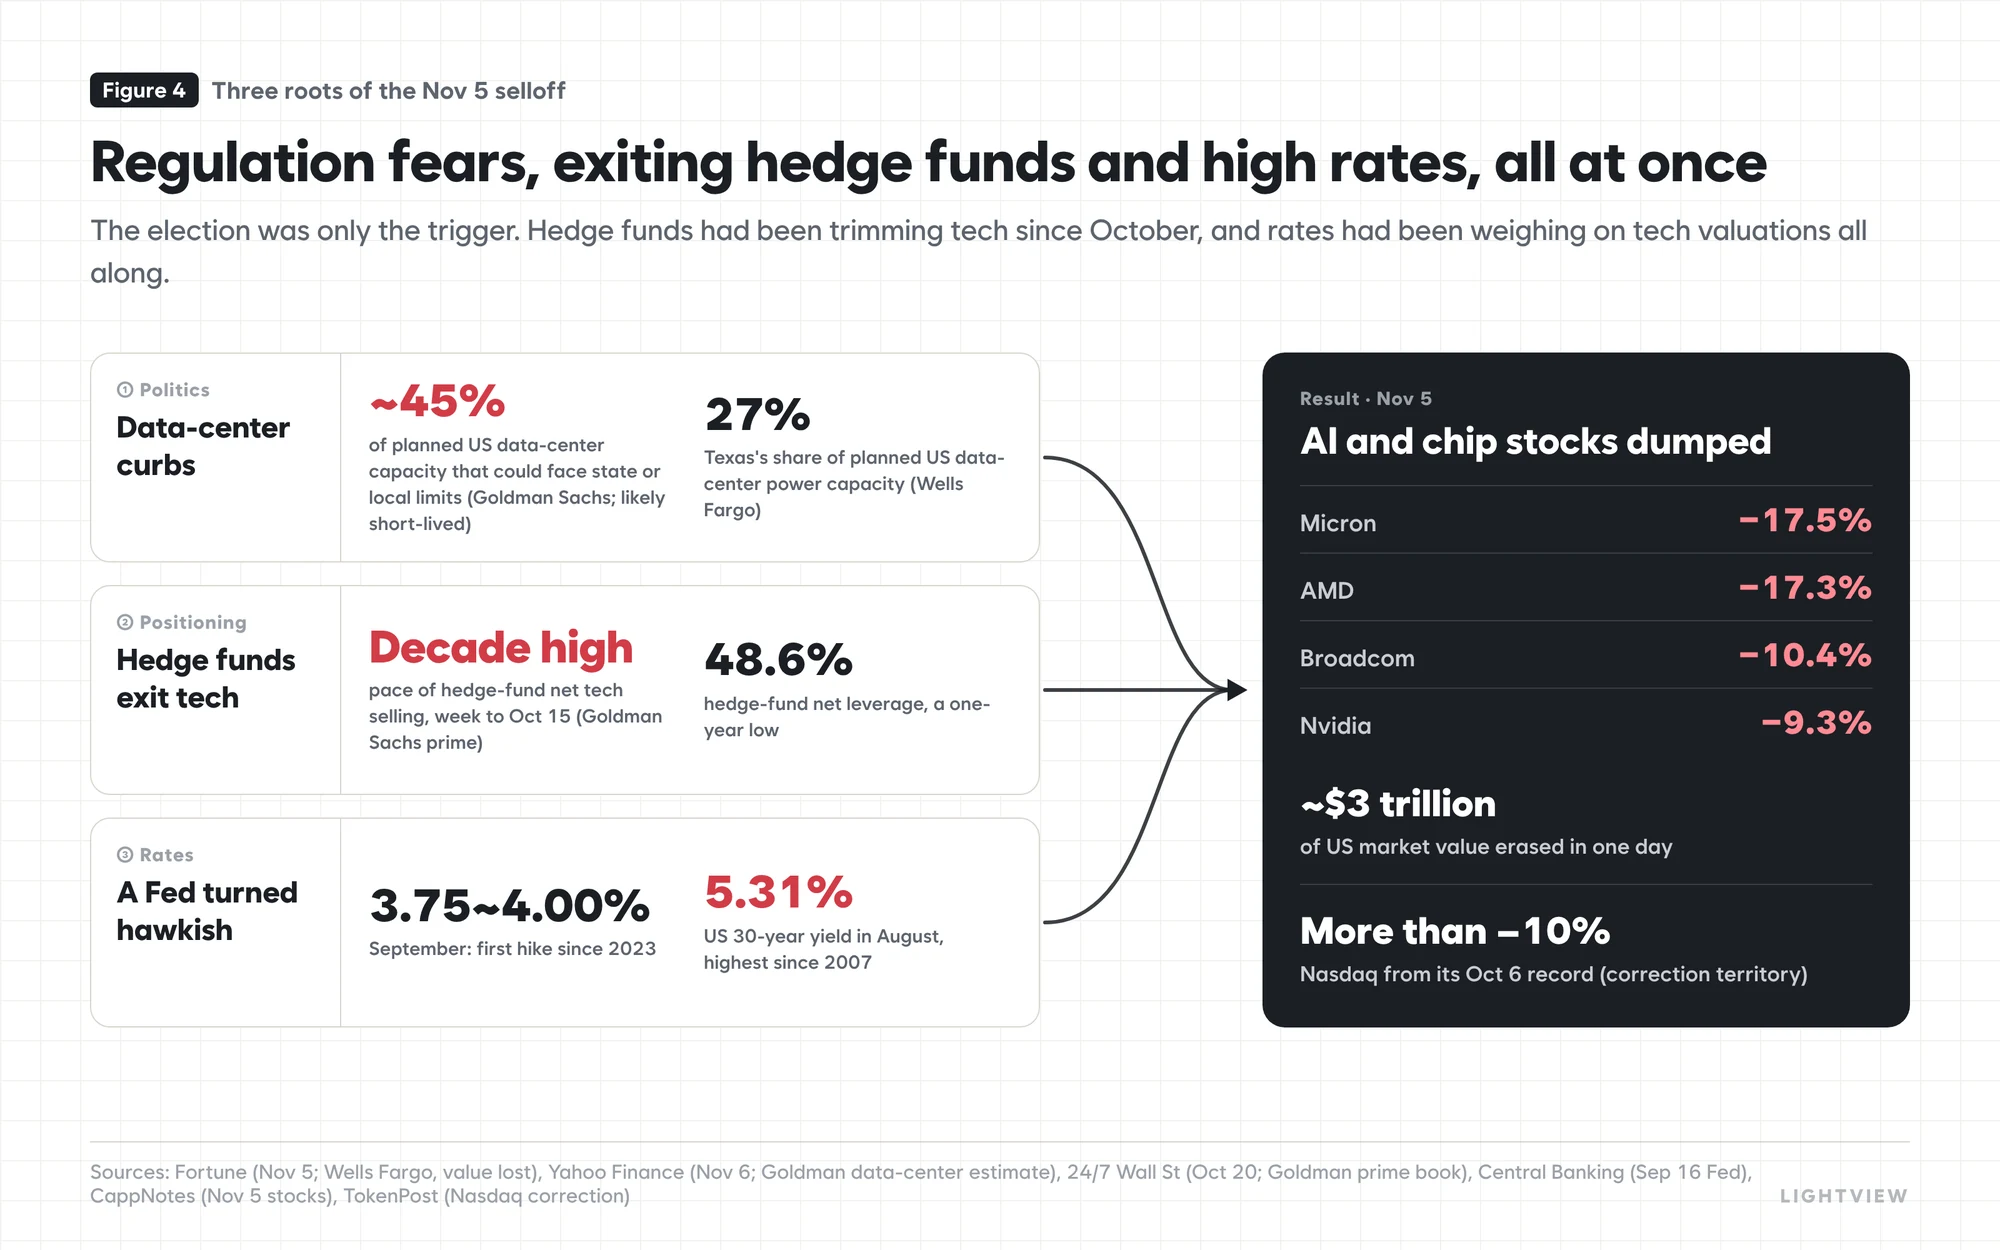
The third strand is rates. In September the Fed raised its policy rate for the first time since 2023, to 3.75–4.00%, and the 30-year Treasury yield reached 5.31% in August, its highest since 2007. For tech stocks valued on profits far in the future, high long-term yields raise the discount rate in their own right.
With all three pressures landing at once, Micron and AMD fell more than 17% in a day and Nvidia 9.3%. The Nasdaq slipped more than 10% below its October 6 record and into a correction, and the market's question narrowed to one: is this the start of a 2000-style bubble bursting?
4Measuring today with 2000's yardsticks
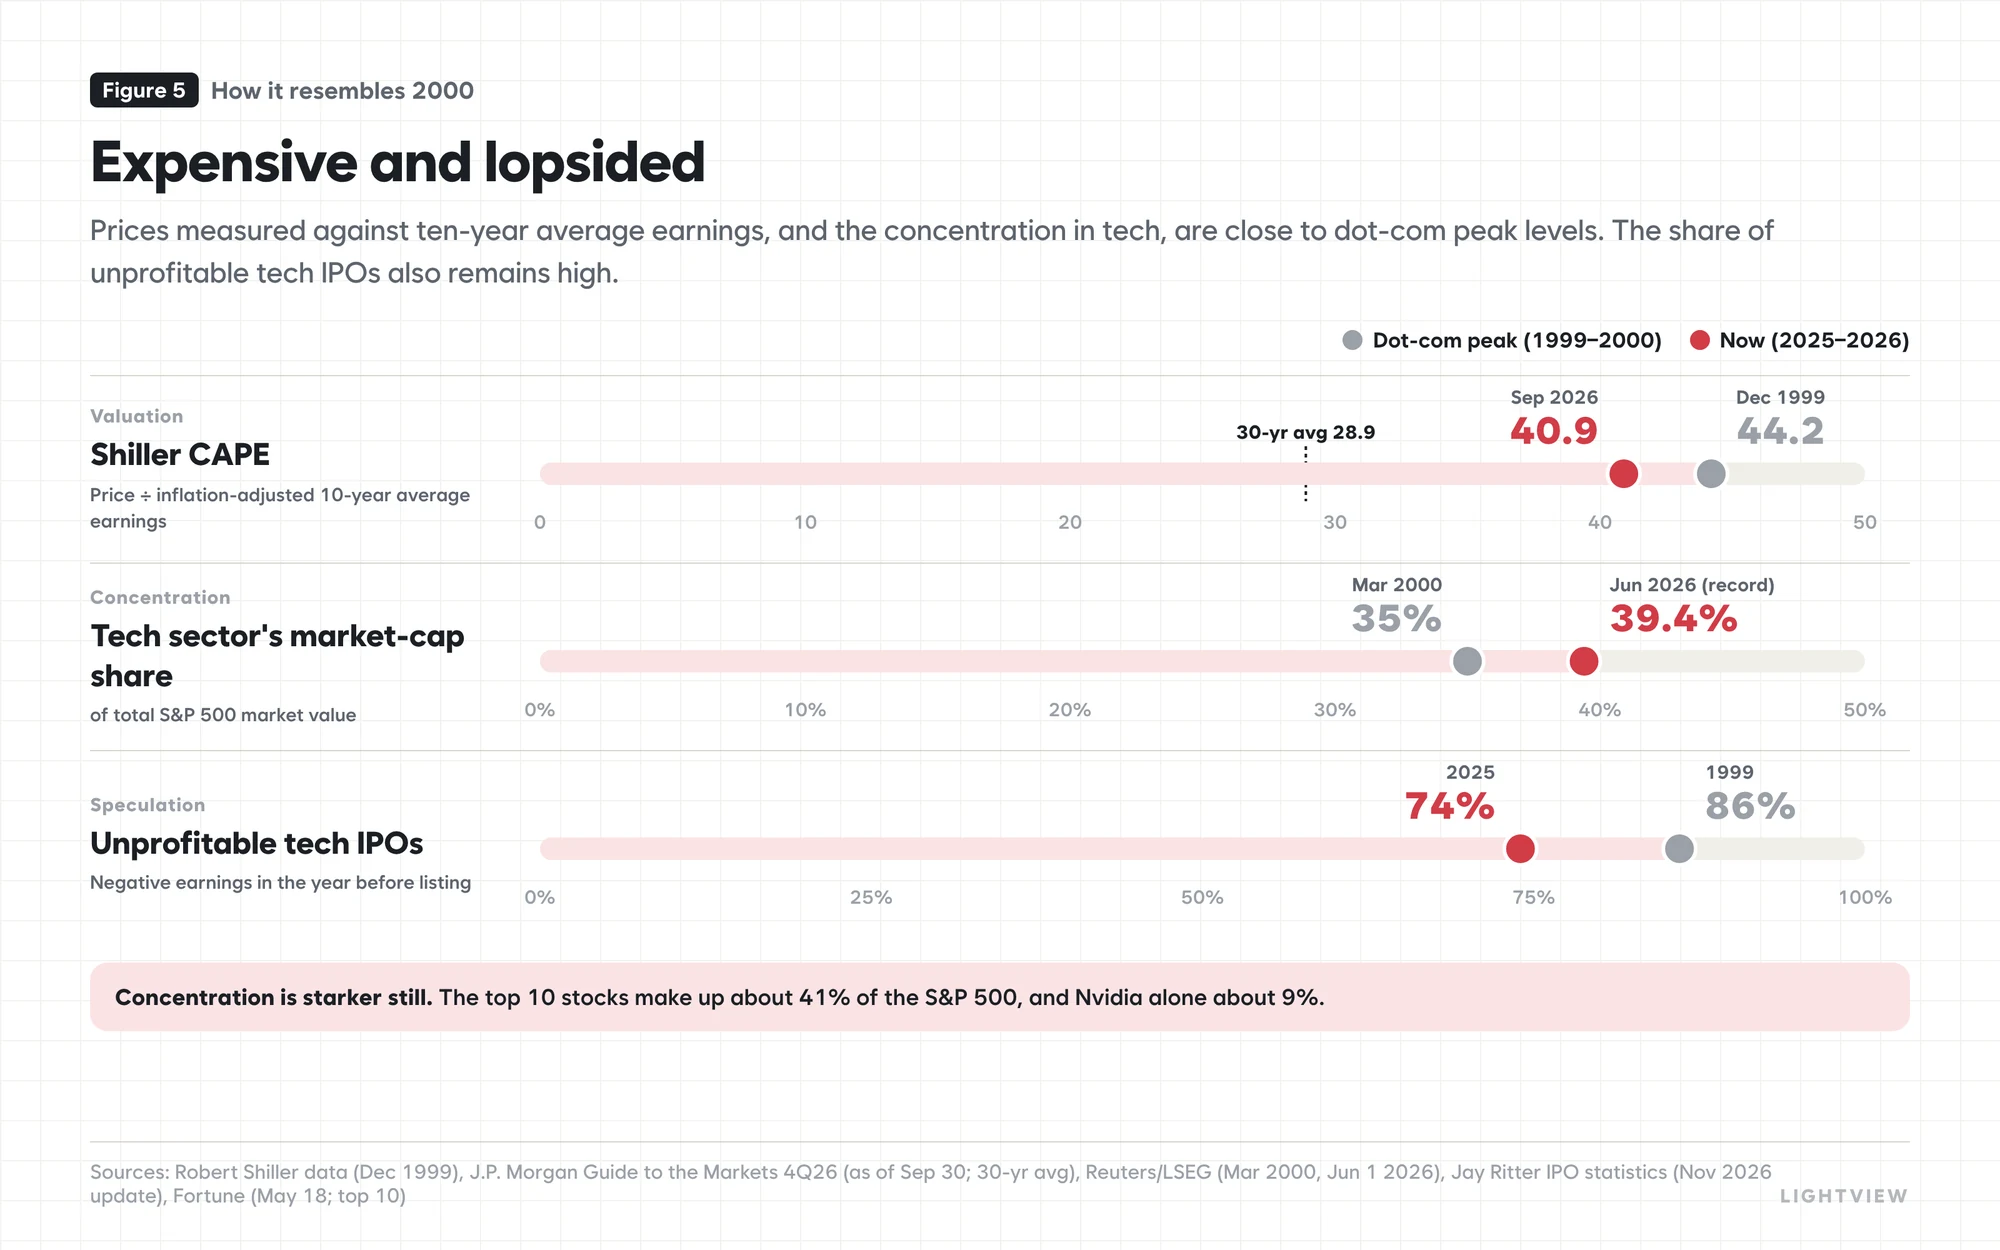
The similarities give real grounds for concern. The Shiller CAPE, price divided by ten-year inflation-adjusted average earnings, stood at 40.9 at the end of September, well above its 30-year average of 28.9 and close to the December 1999 record of 44.2. Tech's share of S&P 500 market value reached 39.4% in June, above the roughly 35% of March 2000, and 74% of tech IPOs last year were unprofitable in the year before listing, below 1999's 86% but a sign that some froth remains.
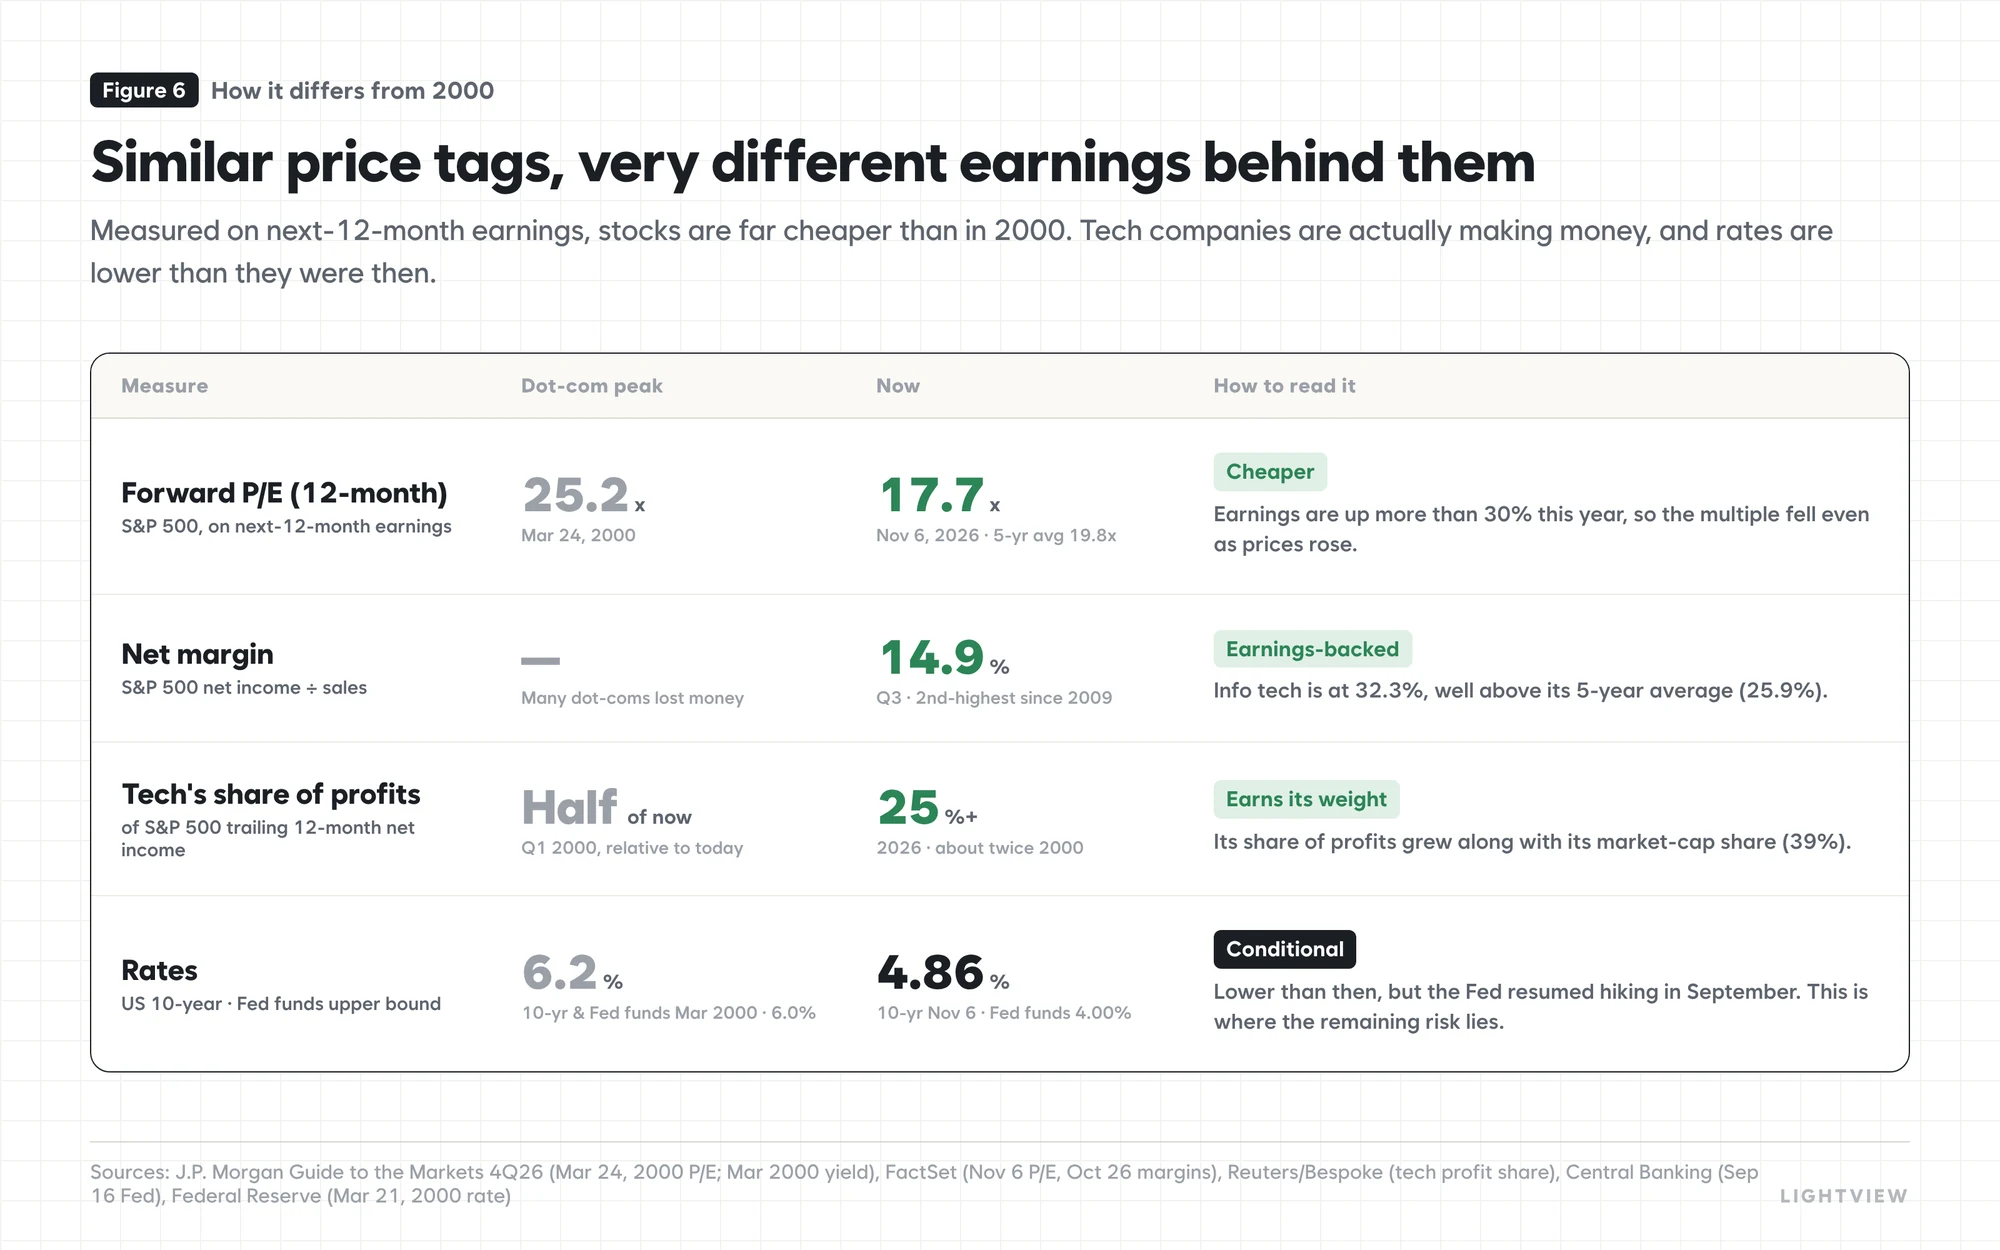
Switch to forward earnings, though, and the picture changes. The S&P 500's 12-month forward P/E was 17.7x on November 6, far below the 25.2x of March 2000 and even below its five-year average of 19.8x. Earnings growing more than 30% this year have kept pace with prices: the Q3 net margin of 14.9% was the second highest since 2009, and tech's share of total profits is about twice what it was in 2000.
5Profits spreading from the few to the many
Looking back at 2000, the decisive weakness was that earnings rested on a handful of companies. How broad are today's earnings?
According to FactSet, Magnificent 7 earnings grew 22.6% in Q3, while the other 493 companies grew 32.6%, overtaking the mega-caps that have led the market for the first time since Q4 2022. Q4 estimates of 22.6% and 30.8% point the same way. It can be read as a sign that leadership is shifting from the few to the many, and it can also cushion the index when the biggest names wobble.
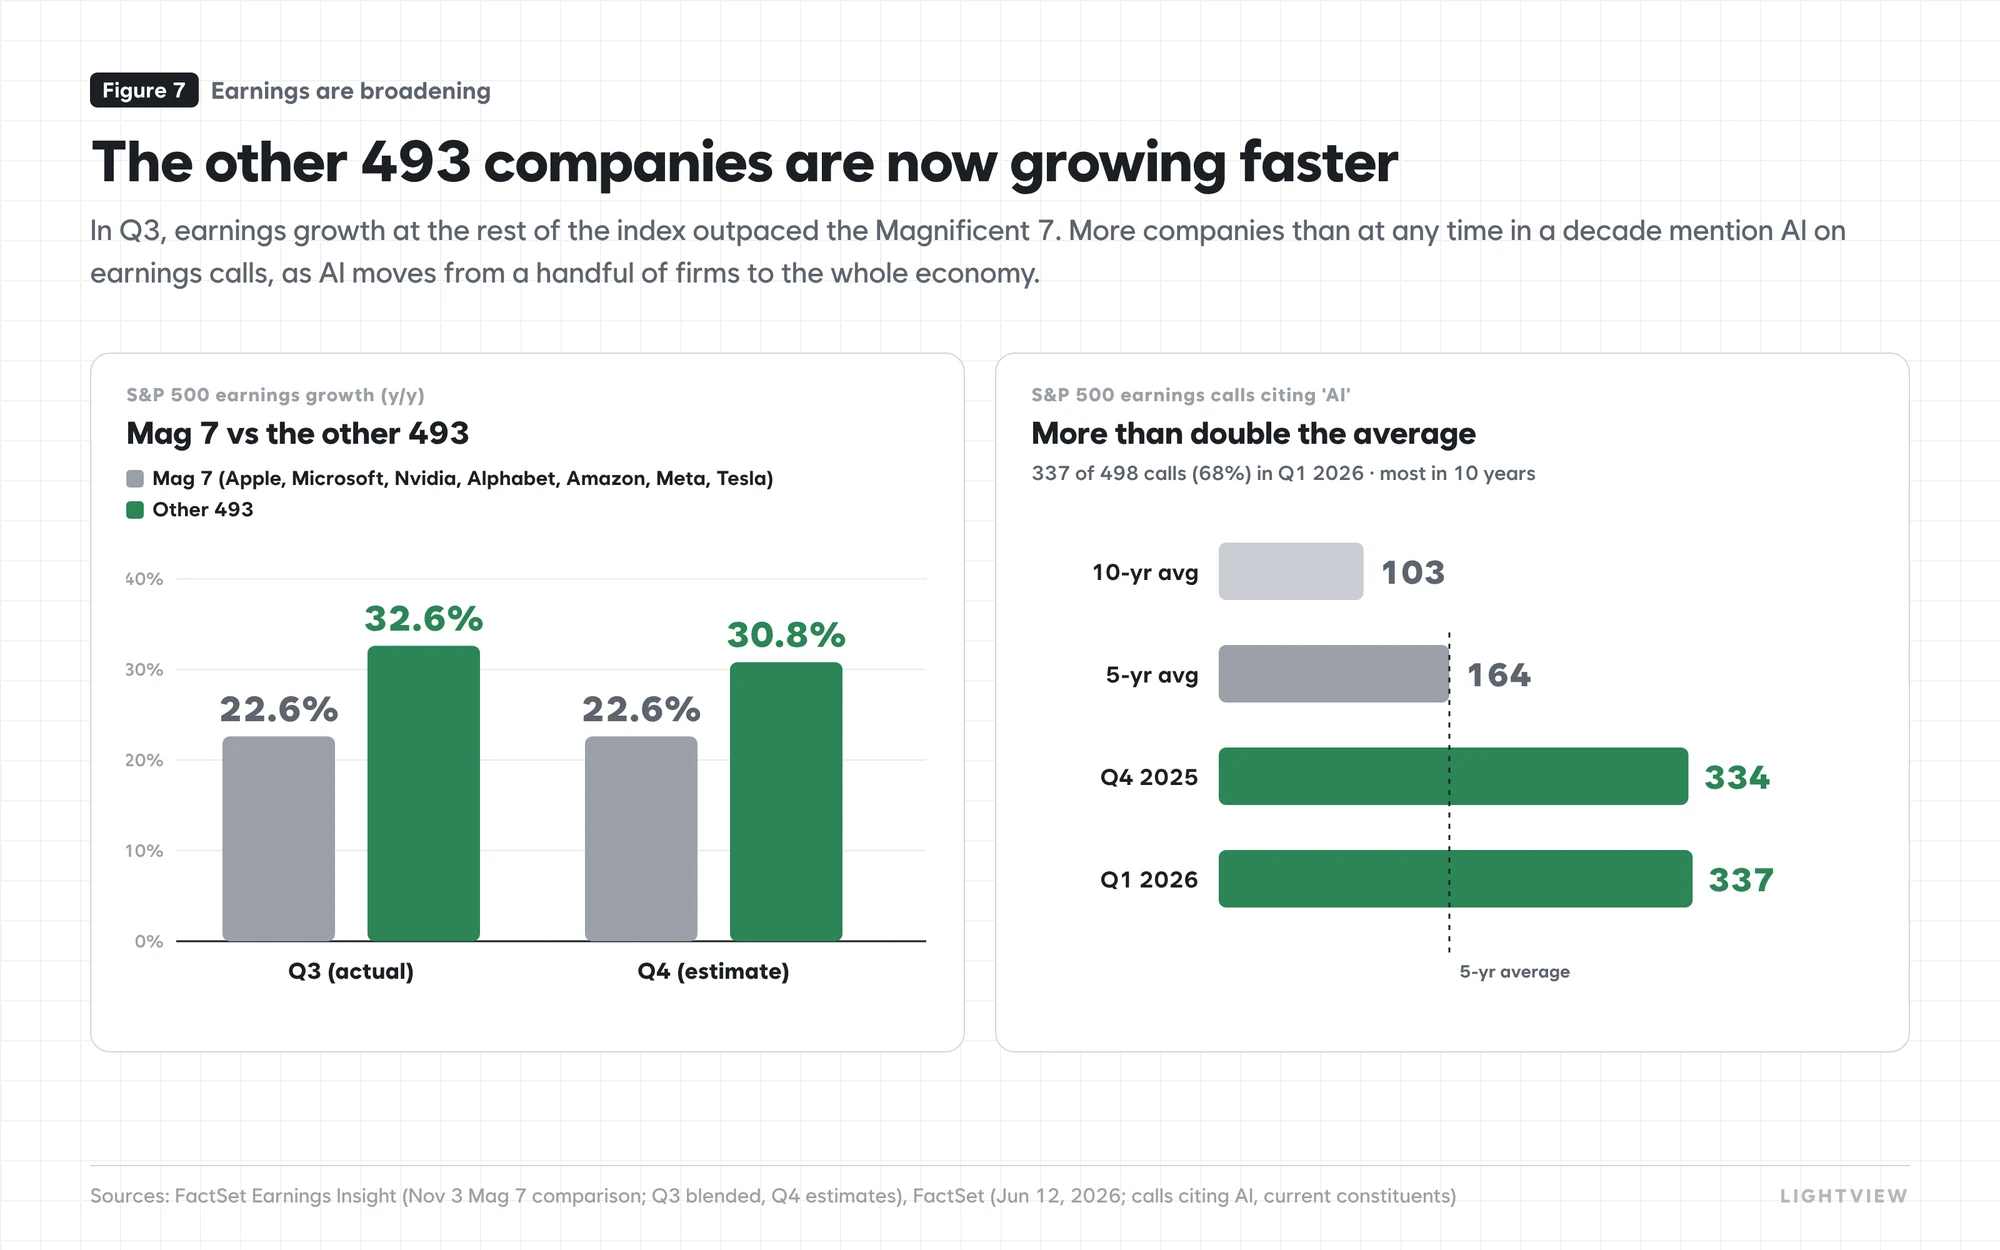
The numbers also show AI spreading beyond a few tech firms. In Q1 earnings calls, 337 of 498 S&P 500 companies (68%) mentioned AI, the most in a decade and more than double the five-year average of 164. Talk is not profit, but where the internet of 2000 was mostly a story about the companies selling it, today's AI is fast becoming a story about the companies using it.
6Who pays for AI, and what risk remains
None of this means the differences from 2000 are a reason to relax. Today's AI market carries risks that did not exist in 2000, or that are growing in a familiar way.
The 2026 capex guided in Q3 earnings by Amazon (about $220 billion), Alphabet (about $200 billion), Microsoft (about $170 billion) and Meta (about $140 billion) adds up to roughly $730 billion. So far it has come mostly from operating cash, but five big tech firms issued $220 billion of bonds over the past year, and the IMF points to $300 billion of circular deals between hyperscalers and financially weaker AI firms, topped up by $650 billion of debt.
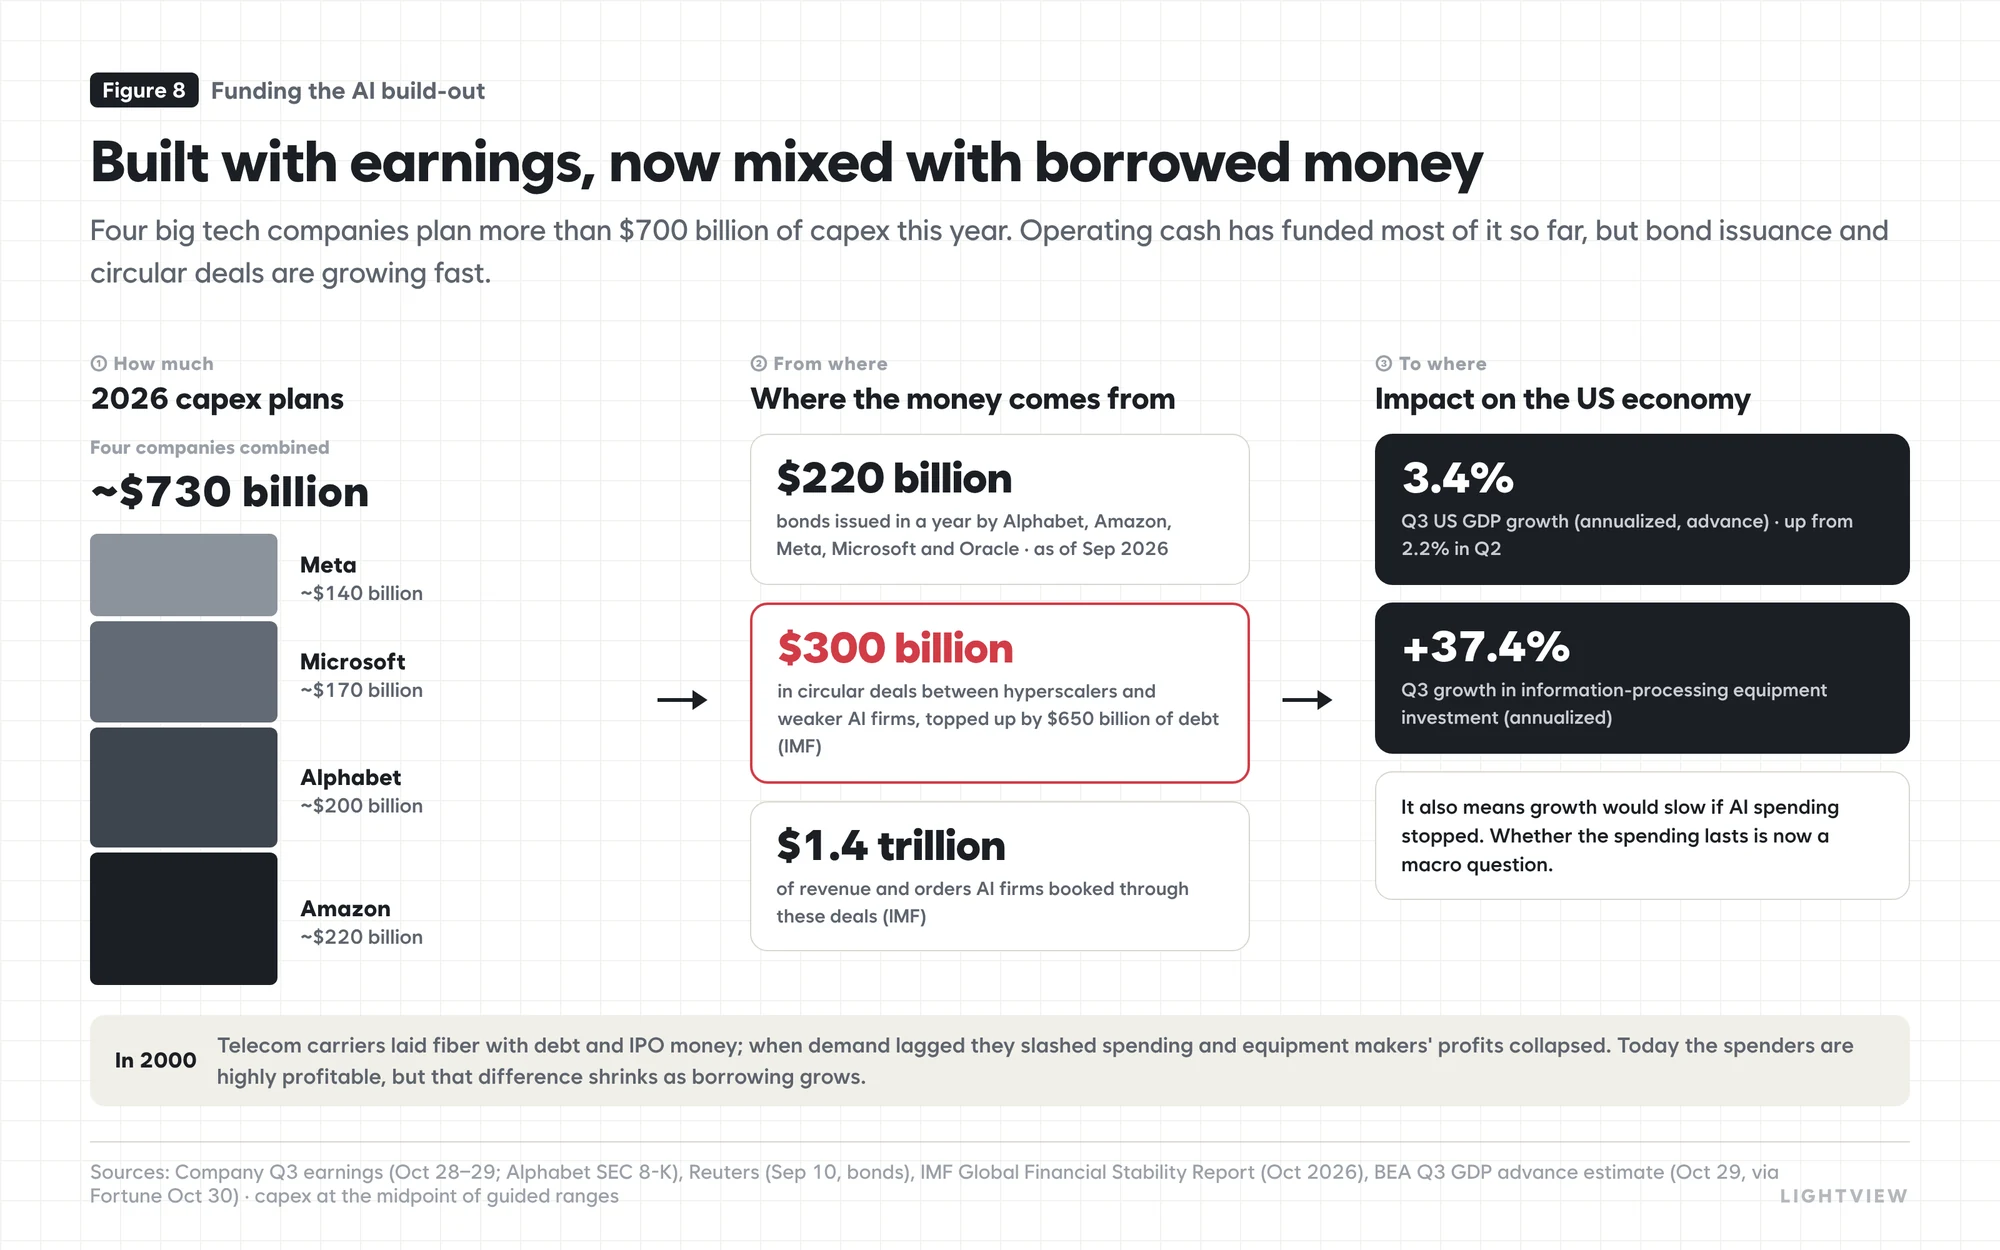
This spending already moves the US economy. Q3 GDP grew at a 3.4% annualized pace, up from 2.2% in Q2, and investment in information-processing equipment rose 37.4%. Put the other way round, growth could slow the moment AI spending stops, so whether the spending lasts has become a question for the whole economy, not just individual companies.
The telecom boom of 2000 laid fiber with debt and IPO money and stopped abruptly when demand failed to follow. Today's spenders are highly profitable, which is a real difference, but that difference narrows as the share of borrowed money grows.
7The road ahead
Historical statistics point in different directions. According to Carson Group, the S&P 500 rose in the 12 months after every one of the 19 midterms since 1950, by 15.1% on average. Yet RBC's data since 1932 put average annual returns under today's mix, a Republican president with a Democratic Congress, at about 5%, among the lowest of any combination, so neither statistic alone settles the outlook.
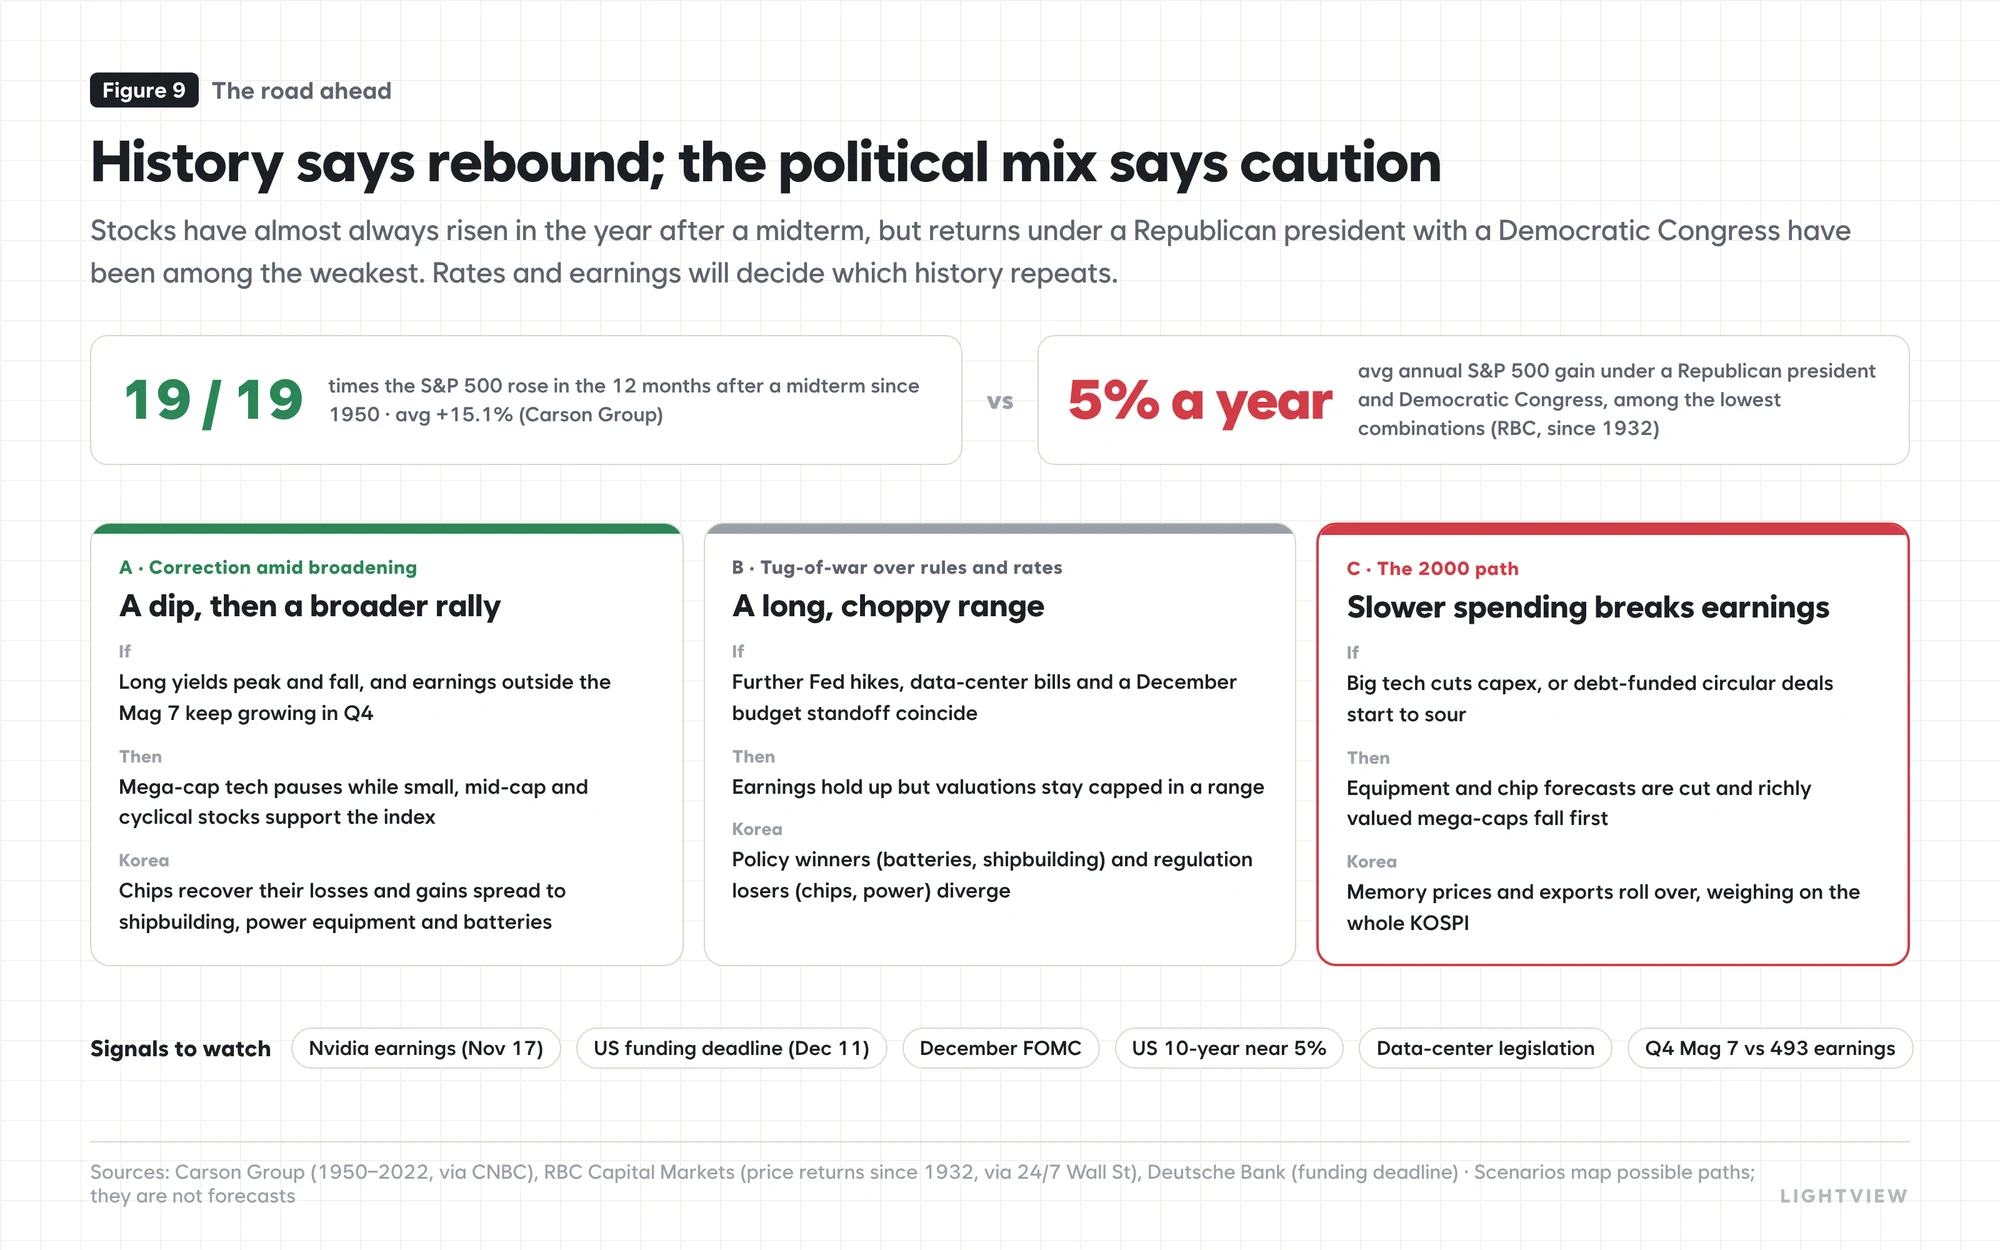
In the end, rates and earnings are likely to decide the path. If long-term yields peak and fall and earnings outside the Mag 7 keep growing in Q4, this decline could remain a correction within a broadening market (A). If further Fed hikes, data-center rules and a budget standoff coincide, the swings could drag on (B). Only if big tech cuts spending or circular deals start to sour does the 2000 path (C) become a realistic scenario.
The near-term checkpoints are Nvidia's earnings on November 17, the US funding deadline on December 11 and the December FOMC. For investors in Korea, it is worth remembering that sectors facing regulatory worries, such as chips and power equipment, and sectors hoping for policy support, such as batteries and shipbuilding, moved in opposite directions on the same vote. What this election changed was not demand for AI but the political conditions for how fast it gets built, and the market has entered a period of testing how solid those conditions are.
+Glossary and sources
Glossary
- AP vote tallies (Yahoo News live blog, Nov 6, 2026; WSOC, Nov 4) · US House election records (1974, 1994, 2006, 2010, 2018) · Hankook Ilbo, Nov 4, 2026
- AP market closes (La Nación, Nov 4; Yahoo, Nov 6) · CappNotes closing notes (Nov 5, 6) · 24/7 Wall St (Nov 5; VIX, sectors) · Motley Fool (Nov 4; 1982 comparison) · Reuters (Nov 4; sector stocks) · Fortune (Nov 5; ballot measures, Wells Fargo, value lost) · Yahoo Finance (Nov 6; Goldman data-center estimate)
- Supple (Nov 4) · Dailian (Nov 5) · News1 (Nov 6) · eToday (Nov 6) — KOSPI, KOSDAQ, won
- 24/7 Wall St citing Goldman Sachs prime book (Oct 20, 2026) · Central Banking (Sep 16, 2026; Fed hike) · thetrading.tools (30-year yield, Aug 17)
- J.P. Morgan Asset Management, Guide to the Markets 4Q26 (as of Sep 30: CAPE, 2000 P/E, yields) · Robert Shiller data (Dec 1999 CAPE)
- FactSet Earnings Insight (Oct 26 margins, Oct 30 annual earnings, Nov 3 Mag 7 comparison, Nov 6 P/E) · FactSet (Jun 12, 2026; earnings calls citing AI)
- Reuters/LSEG (Jun 3, 2026; tech market-cap share) · Bespoke (tech share of profits) · Fortune (May 18, 2026; top 10, Nvidia weight) · Jay Ritter IPO statistics (updated Nov 5, 2026)
- Company Q3 earnings (Alphabet SEC 8-K and others, Oct 28–29) · Reuters (Sep 10, 2026; big tech bonds) · IMF Global Financial Stability Report (Oct 2026) · BEA Q3 GDP advance estimate (Oct 29)
- Carson Group (post-midterm returns 1950–2022, via CNBC) · RBC Capital Markets (returns by party mix, via 24/7 Wall St, Sep 28, 2026) · Deutsche Bank and Goldman Sachs (funding deadline, tariffs; Fortune, Nov 3)
Election
Markets
Valuation and earnings
Investment and the economy
This column's topic and analytical direction are set by the editor, who reviews and revises it before publication. AI tools were used for research, drafting and infographics, and every figure was checked against its source.