1A Price That Rose Twice
Since the Iran war began, the market has fixated on one question: when will the Strait of Hormuz reopen? Yet a closer look at this year's LNG prices reveals a stretch that the strait alone cannot explain.
On February 27, just before the war, the Asian spot LNG price (JKM) stood at $10.9 per million BTU. By October 30 it had climbed above $34, level with Europe. Prices tripled in only eight months, and by mid-September LNG had already risen three times as fast as Brent crude, a sign that the centre of gravity of this energy shock lies in gas rather than oil.
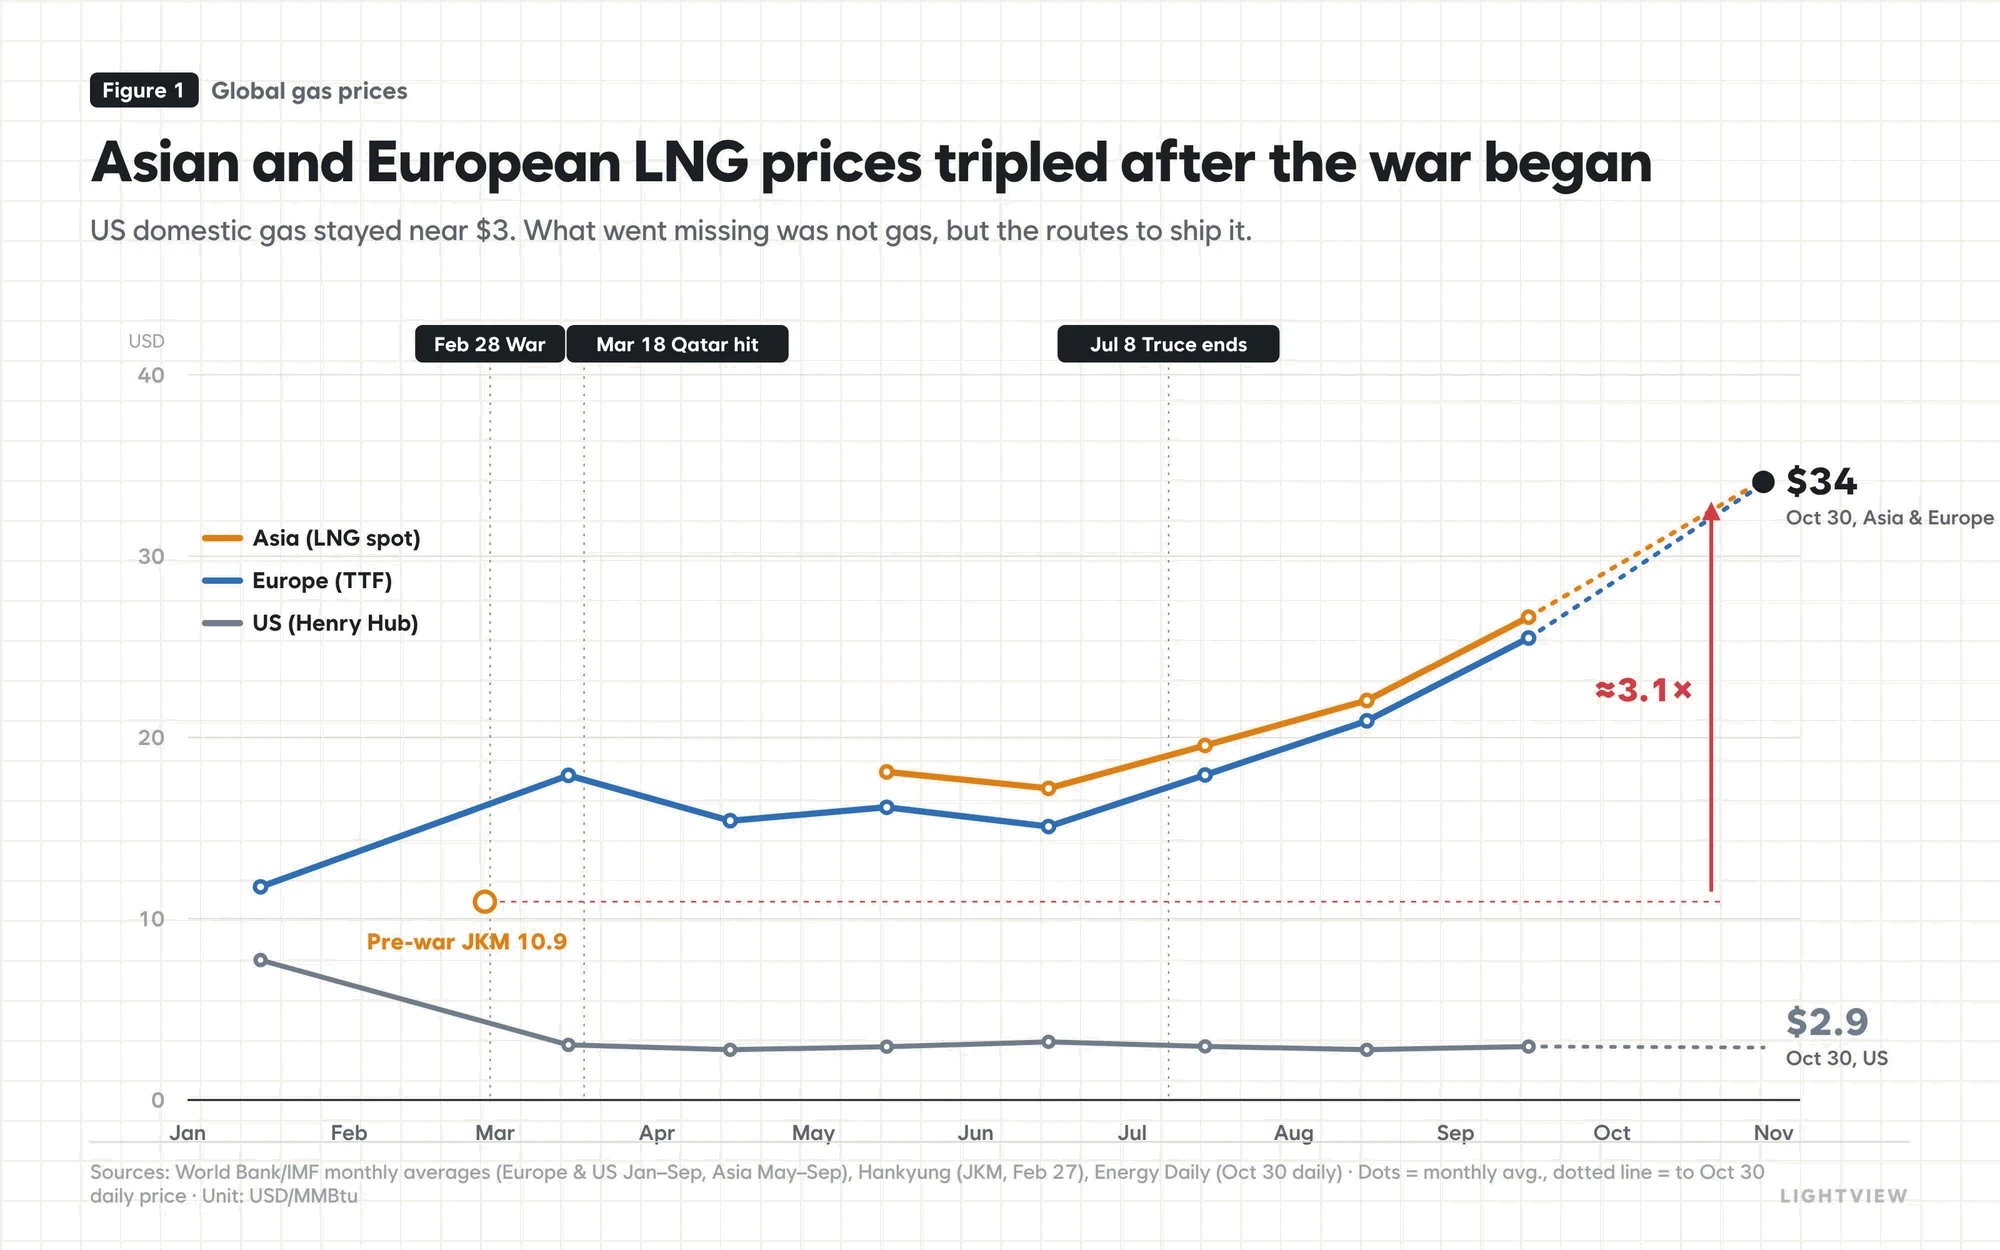
What stands out is that the rise did not happen all at once. Prices jumped as soon as Qatar halted production in March, but then moved within a $15–20 range through the summer, suggesting the market had largely absorbed the first shock. It was only in October that prices began to climb steeply again, and this second leg had an entirely different cause, which is the focus of this column.
The US line at the bottom of the chart deserves attention too. Apart from a brief spike in January, US domestic gas prices hovered around $3 all year. The same gas sells for $3 in America and $34 across the ocean, which supports the view that prices rose not because the world ran short of gas, but because it ran short of the routes and facilities needed to move it.
2The First Wave: The Hormuz Blockade
The first wave was by no means small. A sea lane that carried roughly 20% of global LNG trade closed almost overnight.
When the war broke out in late February and the Strait of Hormuz was blockaded, Qatar halted gas production in early March and declared force majeure. On March 18, air strikes damaged 17% of its export capacity. With Qatar's energy minister himself warning that repairs could take three to five years, supply is unlikely to return to normal immediately even if the strait reopens. Qatari LNG exports fell 96% year on year between March and August, effectively removing one of the world's major exporters from the market.
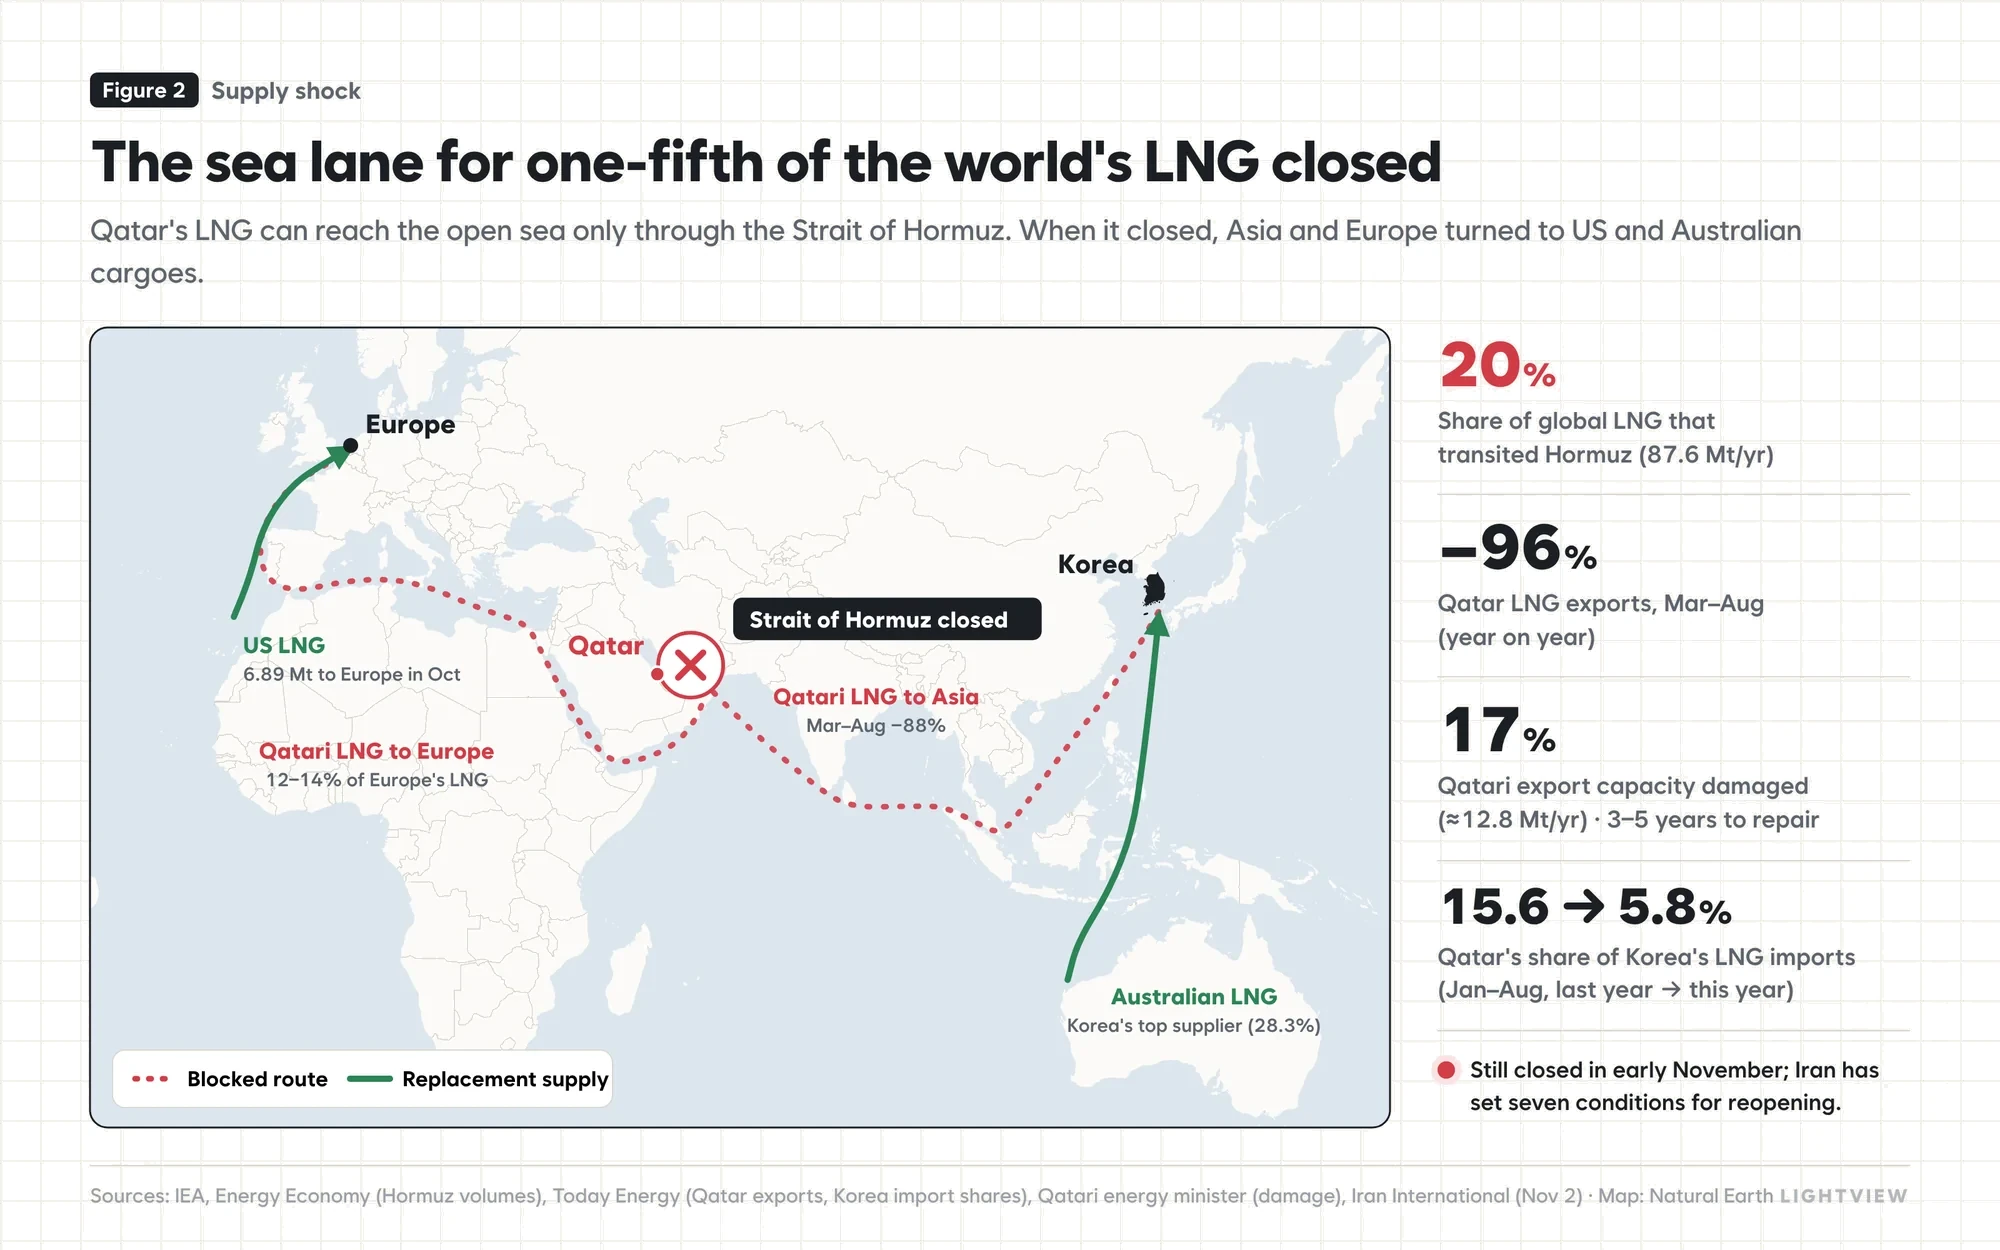
Even so, the market adjusted faster than expected. Asian importers quickly shifted to Australia, Malaysia and the US, and Korea cut Qatar's share of its imports from 15.6% to 5.8% while buying more from Australia and America. These alternative supplies are what allowed prices to stabilise at $15–20 over the summer, and it is reasonable to see that range as roughly the level the supply shock alone could justify.
So where did October's renewed surge come from? The answer lies in how Europe prepares for winter.
3The Second Wave: Europe's Unfilled Storage
Europe's winter depends far more on gas stored underground during the summer than on LNG bought as needed. Once this structure is clear, October's price movement becomes much easier to read.
Every year Europe injects surplus gas into underground storage from April to October and withdraws it from November to March, with storage covering 25–30% of total gas consumption. Heating demand surges in winter, but pipeline and LNG imports cannot be ramped up quickly, so storage bridges the gap. That is also why the EU set a target of filling storage to 90% before winter.
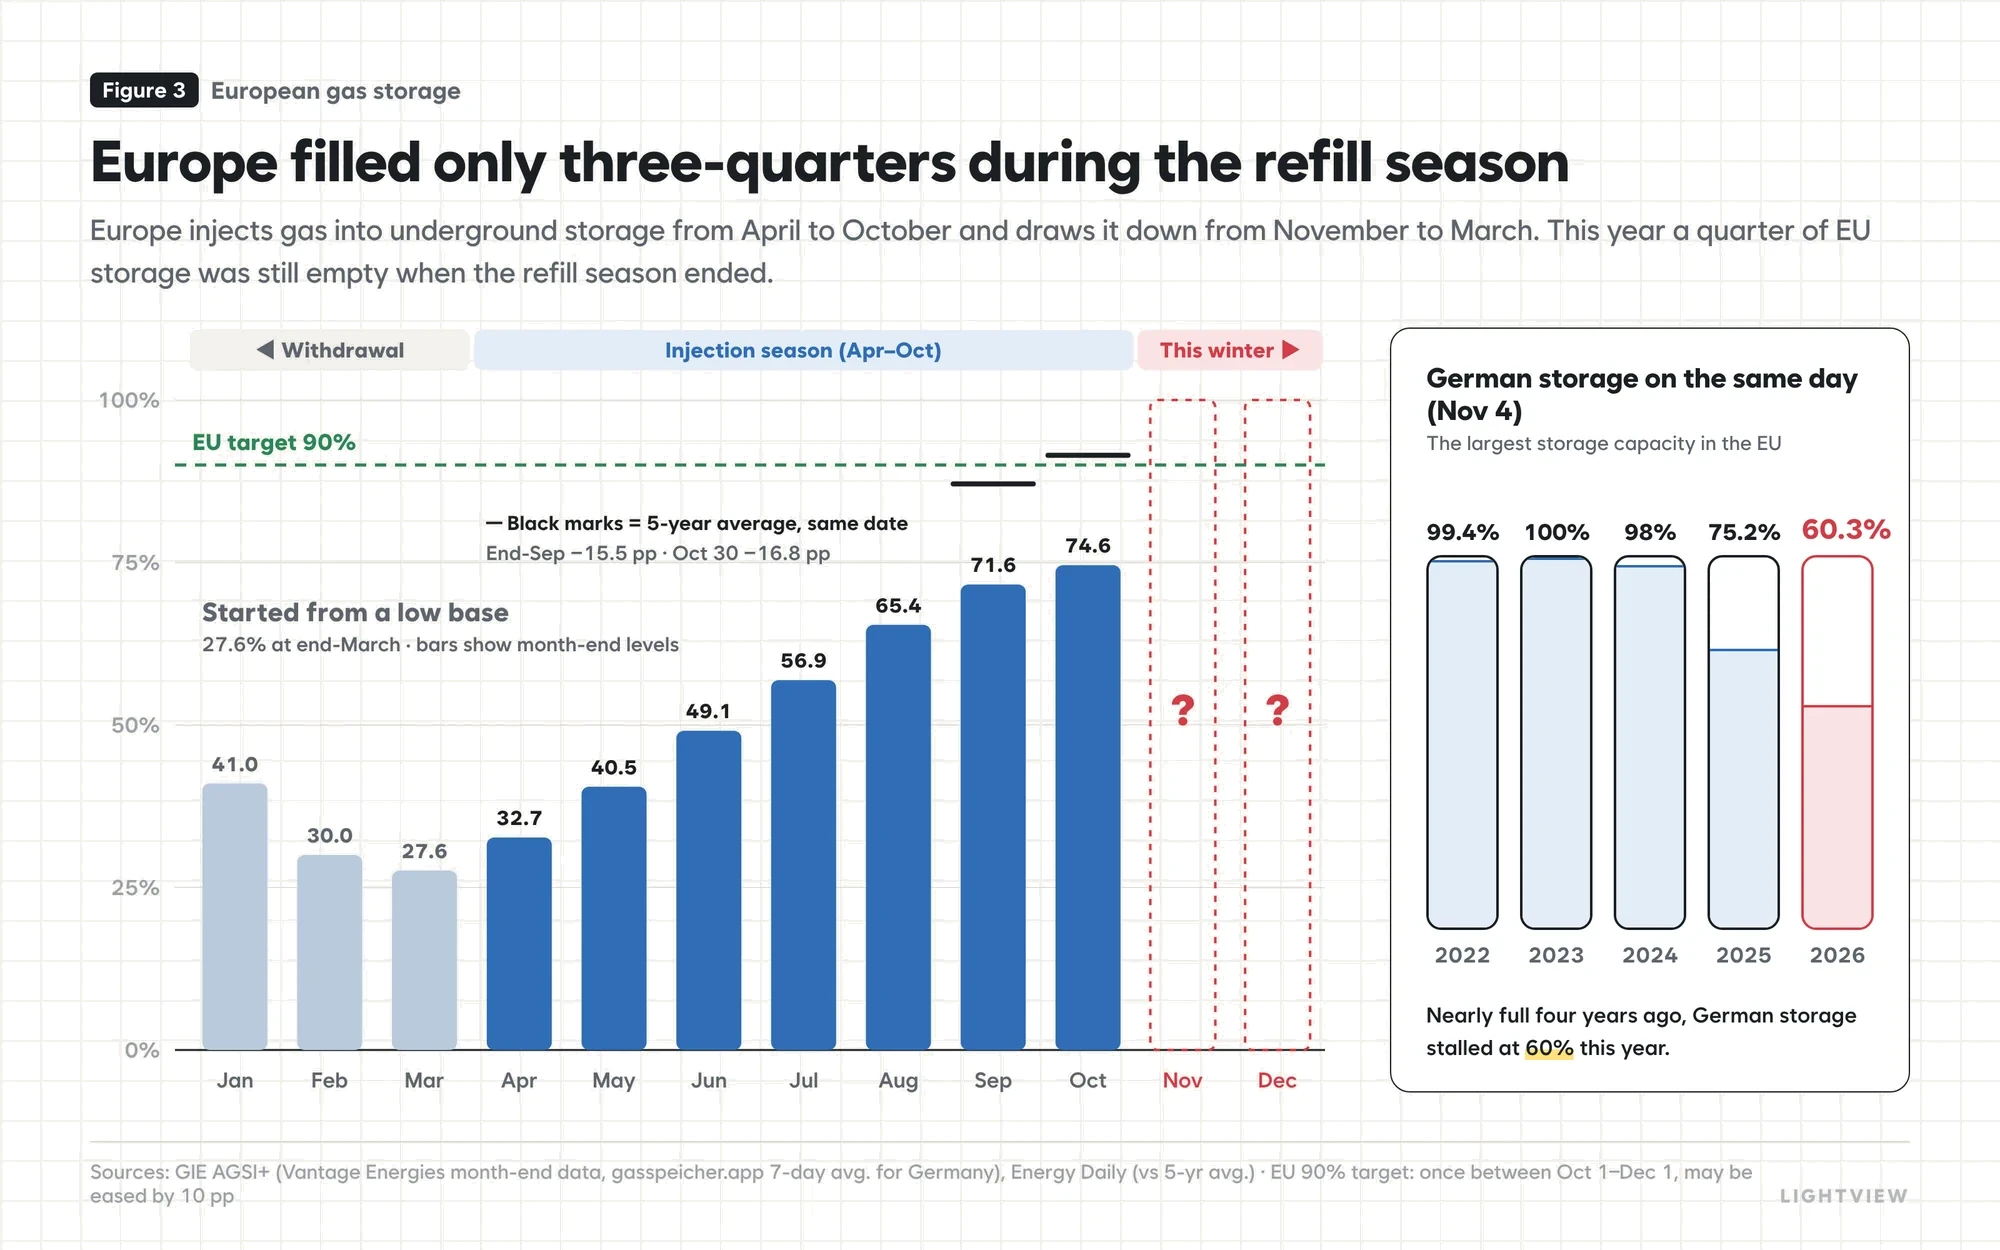
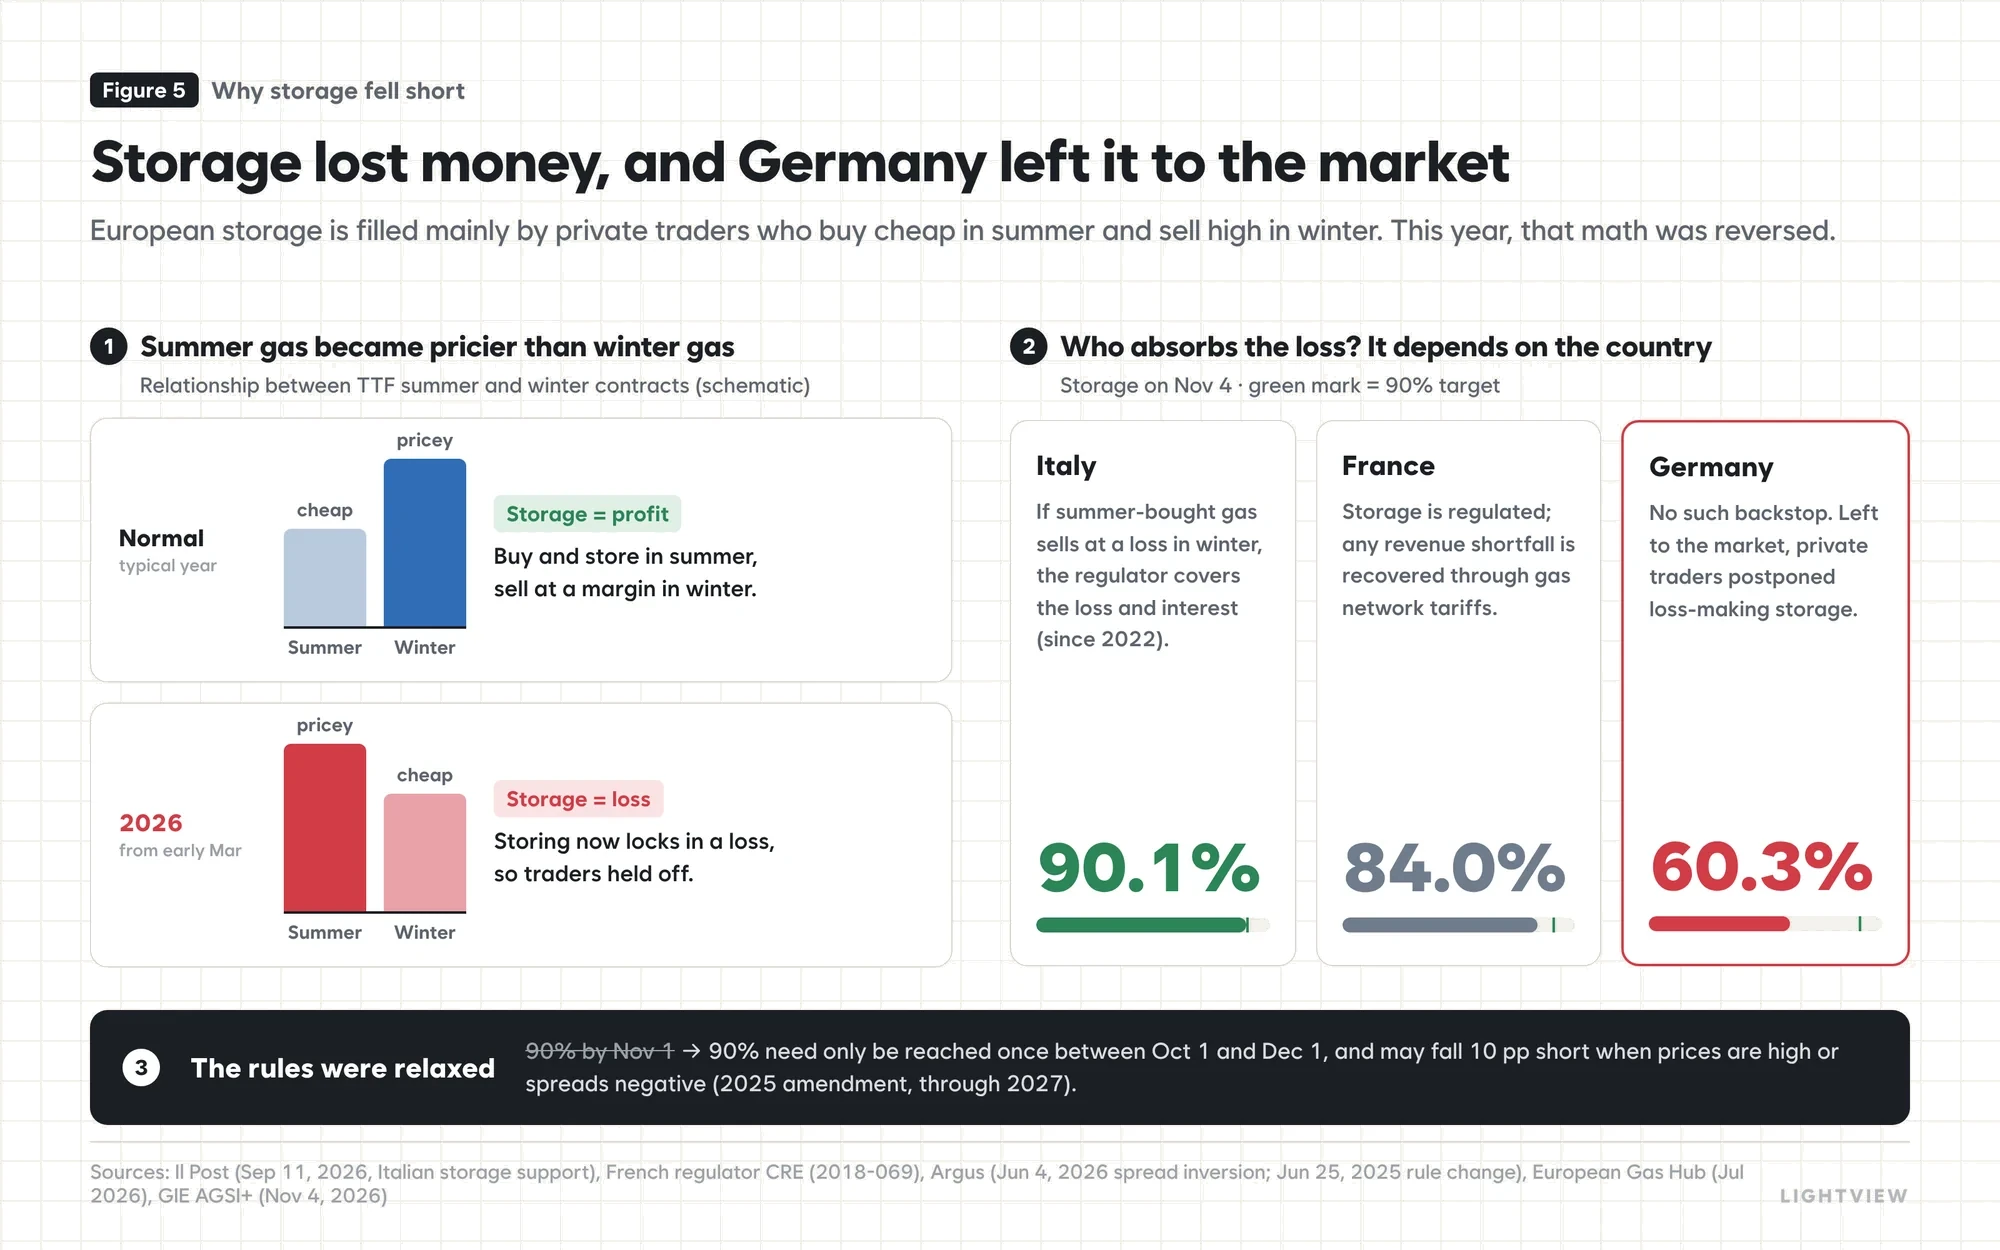
This year Europe fell well short. Having drawn heavily on storage last winter, the EU started from just 27.6% at the end of March, and even when the injection season ended on October 28, storage stood at only 74.9%. That is the lowest level for the date in a decade and 15–17 percentage points below the five-year average. Germany, which has the largest storage capacity, was at 60.3%, a striking contrast with the 99.4% it held on the same day four years ago.
· Early April: injections begin from about 27% · July 1: Germany at 41%, lowest for the date since the energy crisis
· October 28: EU peaks at 74.9%, then withdrawals begin (net withdrawal of about 1.4 TWh/day as of Nov 1)
· December 1: deadline for the EU 90% target (may be eased by 10 pp) · withdrawals continue until March
What the 74% average hides
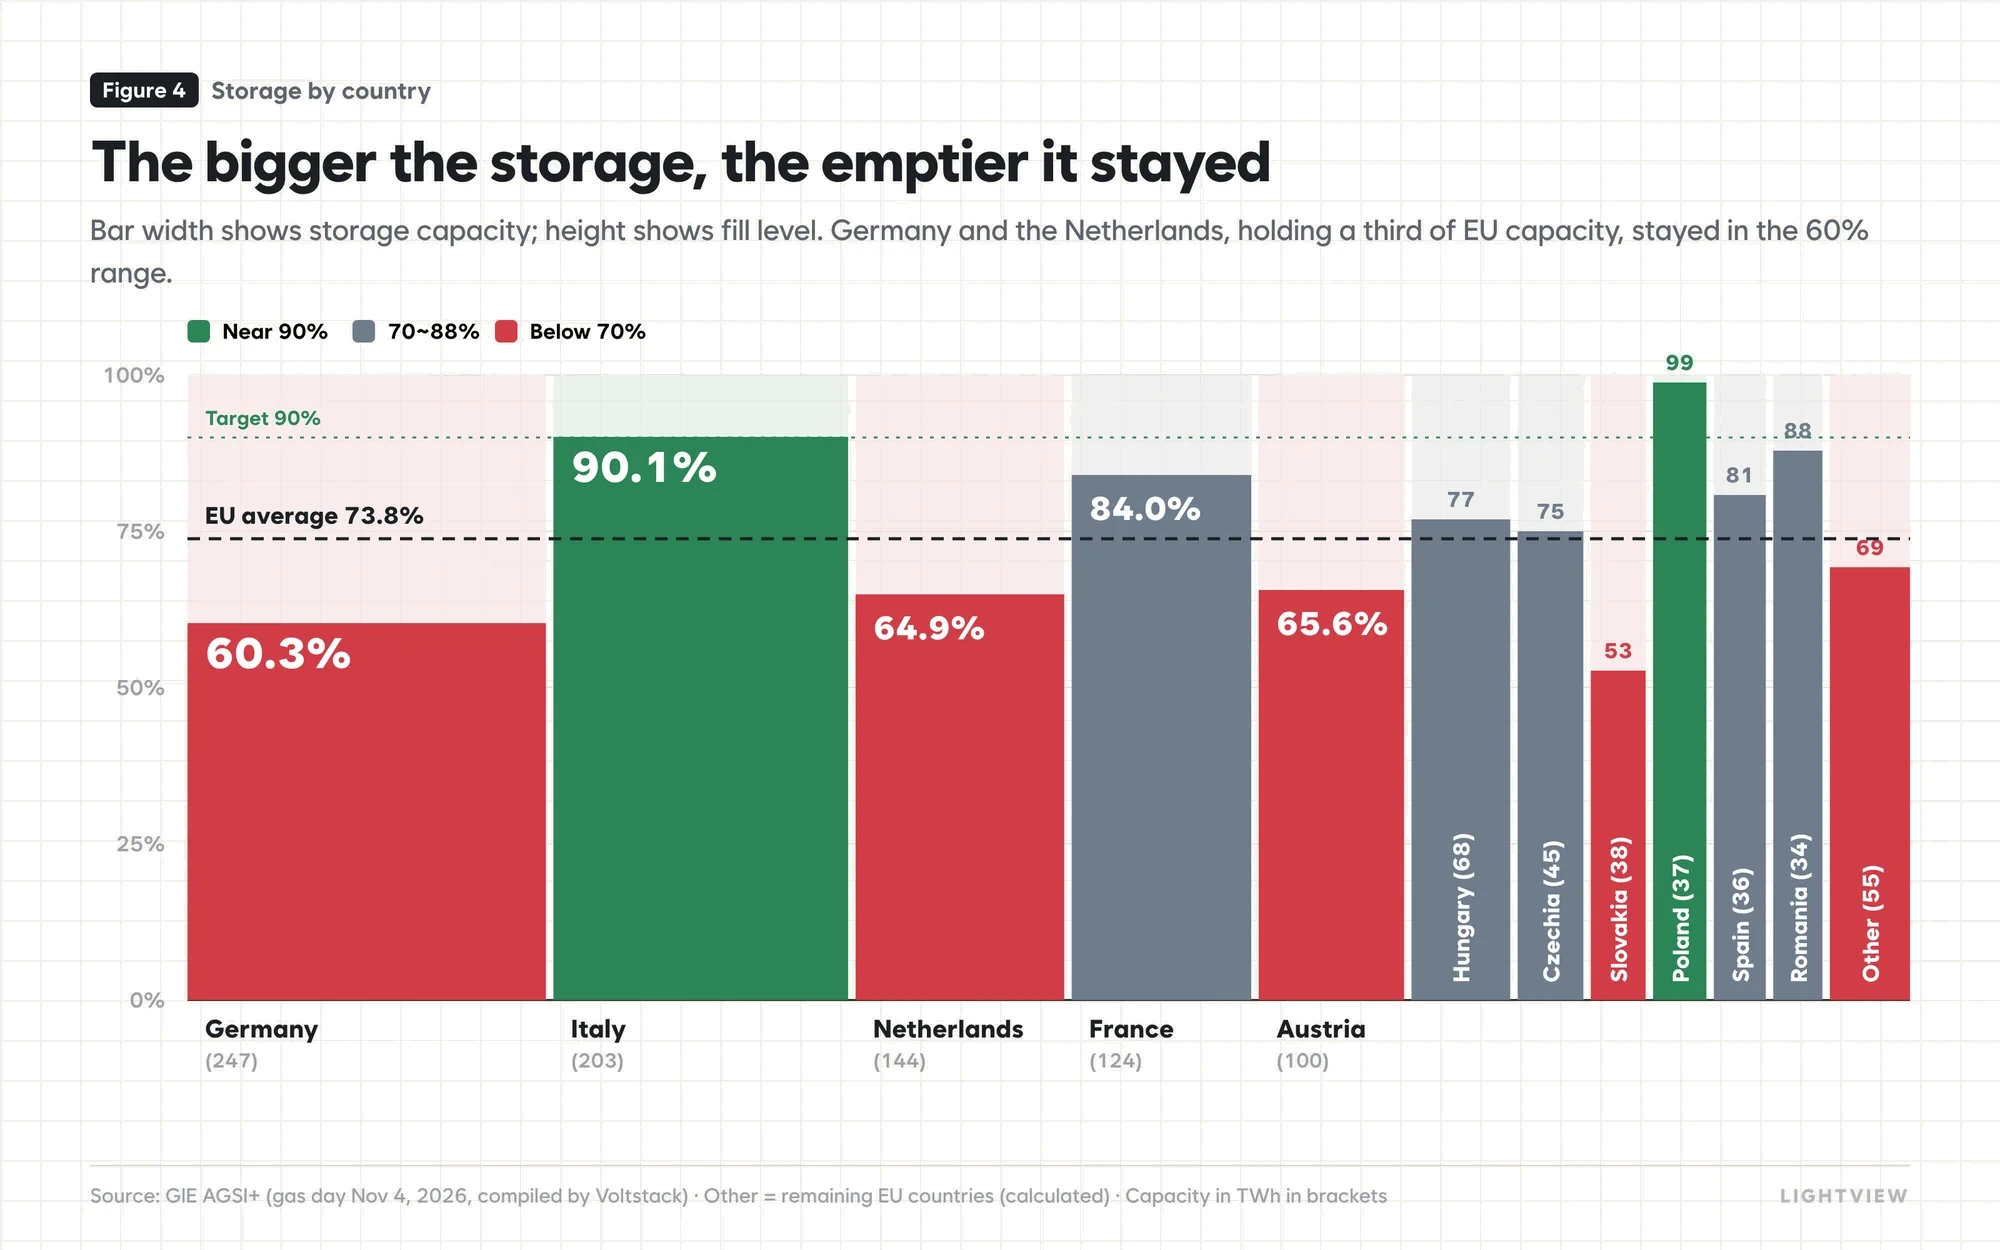
The EU average alone may not look alarming. But while Italy (90.1%) and Poland (98.8%) nearly reached the target, the countries with the lowest fill levels are those with the most capacity. Germany, the Netherlands and Austria all remain in the 60% range, and Germany and the Netherlands together account for a third of total EU storage capacity. Because Europe's gas grid is interconnected, a shortfall in a large country inevitably puts pressure on its neighbours as well.
Why storage fell short: a price inversion and different rules
European storage is filled mainly by private traders, who buy gas in summer and profit from selling it at higher prices in winter. This year, however, summer contracts traded above winter contracts from March onwards, and with every stored cargo locking in a loss, holding back was the economically rational choice. What separated the outcomes was policy. Italy covered storage losses and interest, France recovered revenue shortfalls through network tariffs, while Germany left the matter to the market.
Can 74% get Europe through the winter?
On paper there seems to be some room. Last winter EU storage fell by about 55 percentage points, from roughly 83% to 27.6%. A similar drawdown this year would still leave close to 20% in spring, even starting from 74%. That calculation, however, ignores the physical characteristics of storage.
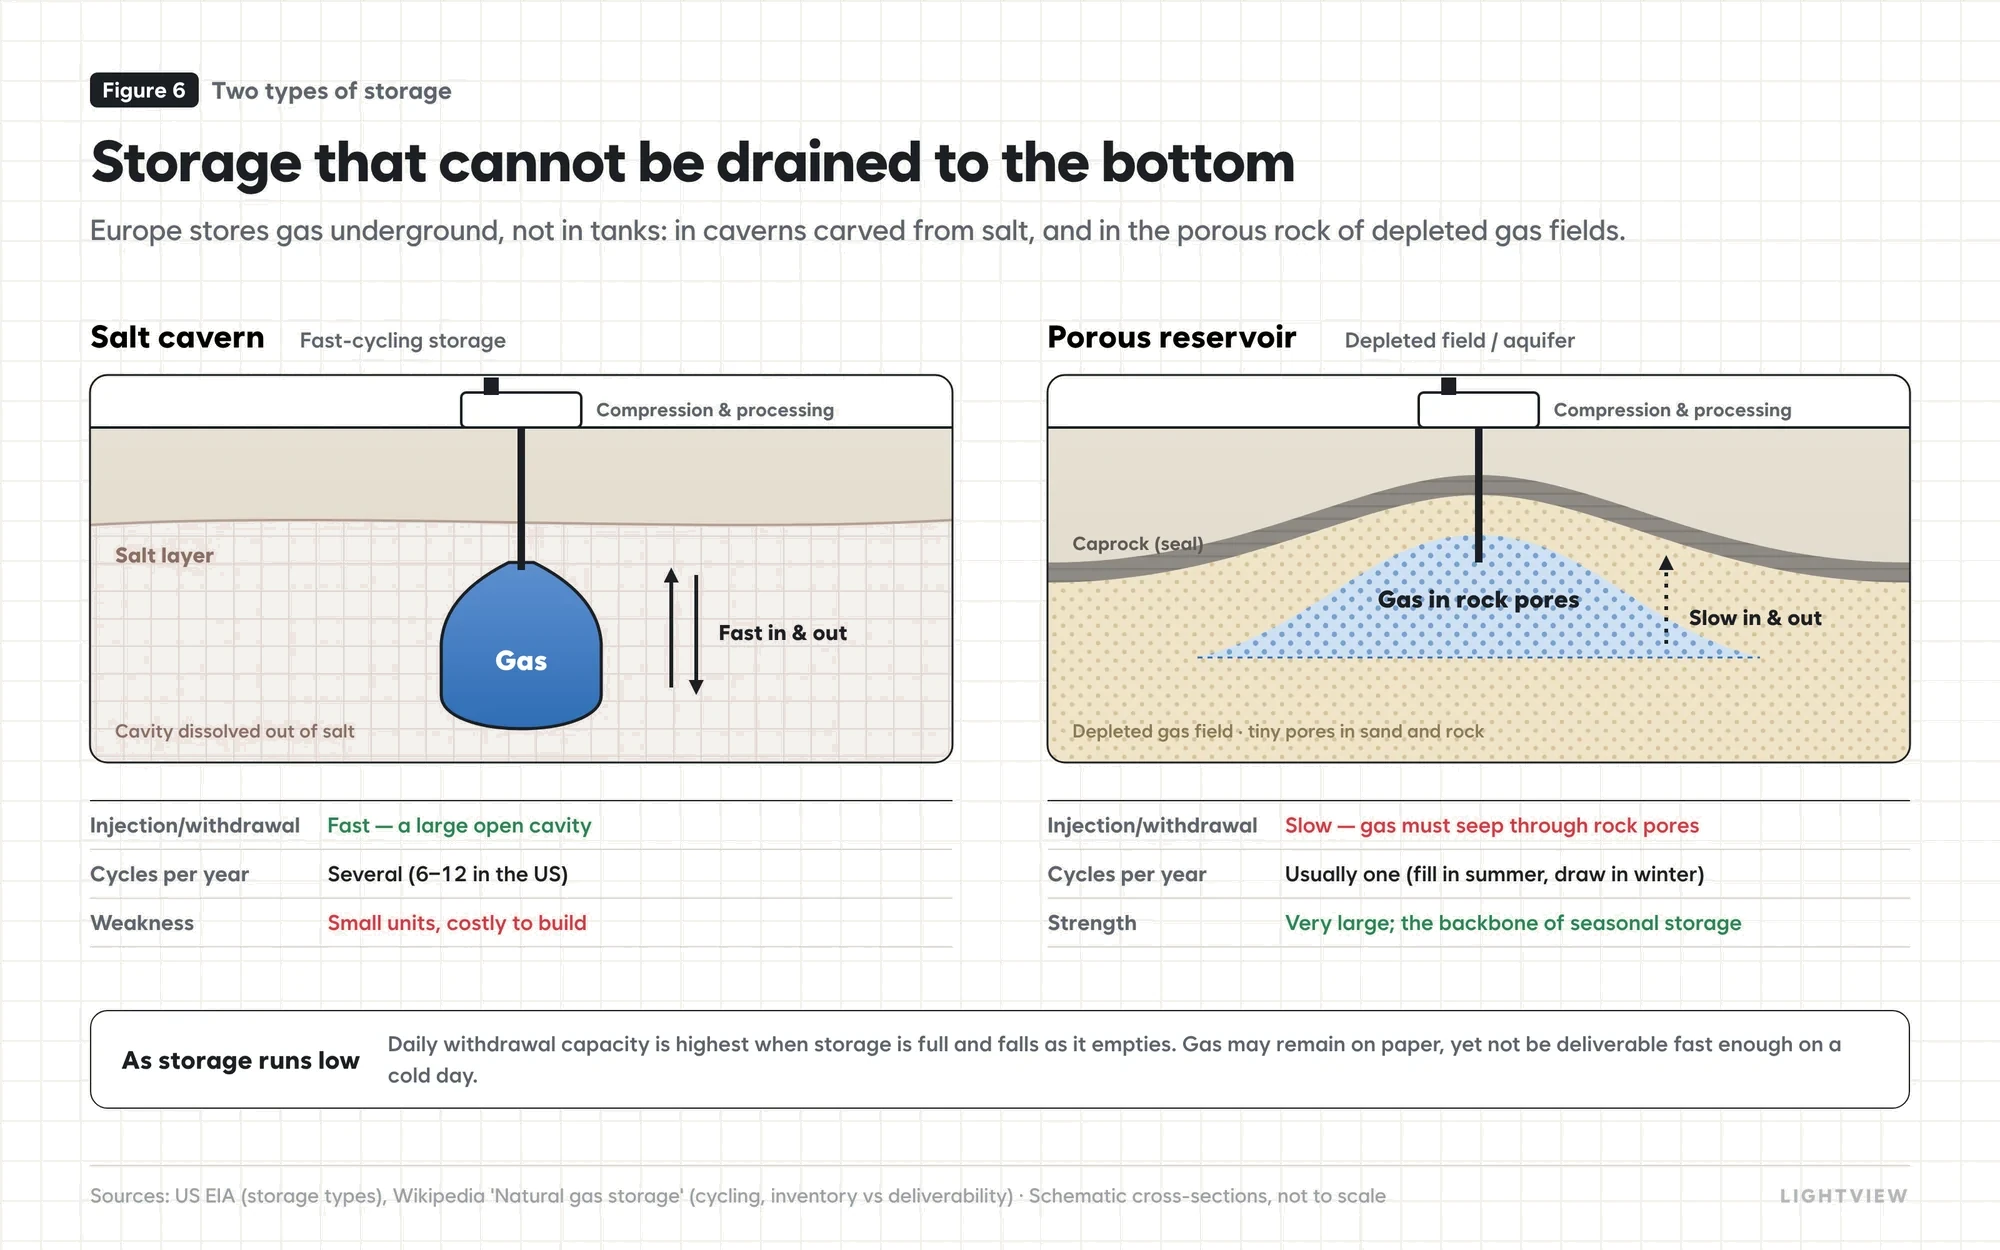
The amount of gas that can be withdrawn each day is highest when storage is full and declines as it empties. Porous reservoirs, the workhorses of seasonal storage, are cycled only once a year, so a 20% fill level does not mean the gas can be delivered quickly enough when a cold snap hits. That is why Europe is rationing withdrawals and turning to the spot market for the shortfall, which can be estimated as follows.
190 TWh ÷ about 15.2 MWh per tonne of LNG ≈ about 12.5 million tonnes
12.5 million tonnes ÷ five winter months (Nov–Mar) ≈ about 2.5 million tonnes of extra demand per month (two-thirds of Korea's monthly imports of about 3.9 Mt)
The winter LNG spot market has traditionally been driven by Northeast Asian buyers such as Korea, Japan and China. With Europe arriving late and adding around 2.5 million tonnes of demand a month, October's renewed surge was, to a large extent, a foreseeable outcome.
4How Much the US Can Cover
Many hoped that the US, awash in shale gas, could solve the problem by exporting more, and it did move quickly to fill Qatar's place.
From January to April, US LNG exports rose by about 7 million tonnes, nearly matching Qatar's decline of about 6.9 million tonnes over the same period. First-half exports were up 23% year on year, shipments to Asia reached a record 10.9 million tonnes in the second quarter, and in October exports to Europe rose by nearly 1 million tonnes in a single month, making it the second-largest export month on record. Even so, Asian and European prices remain stuck above $34.
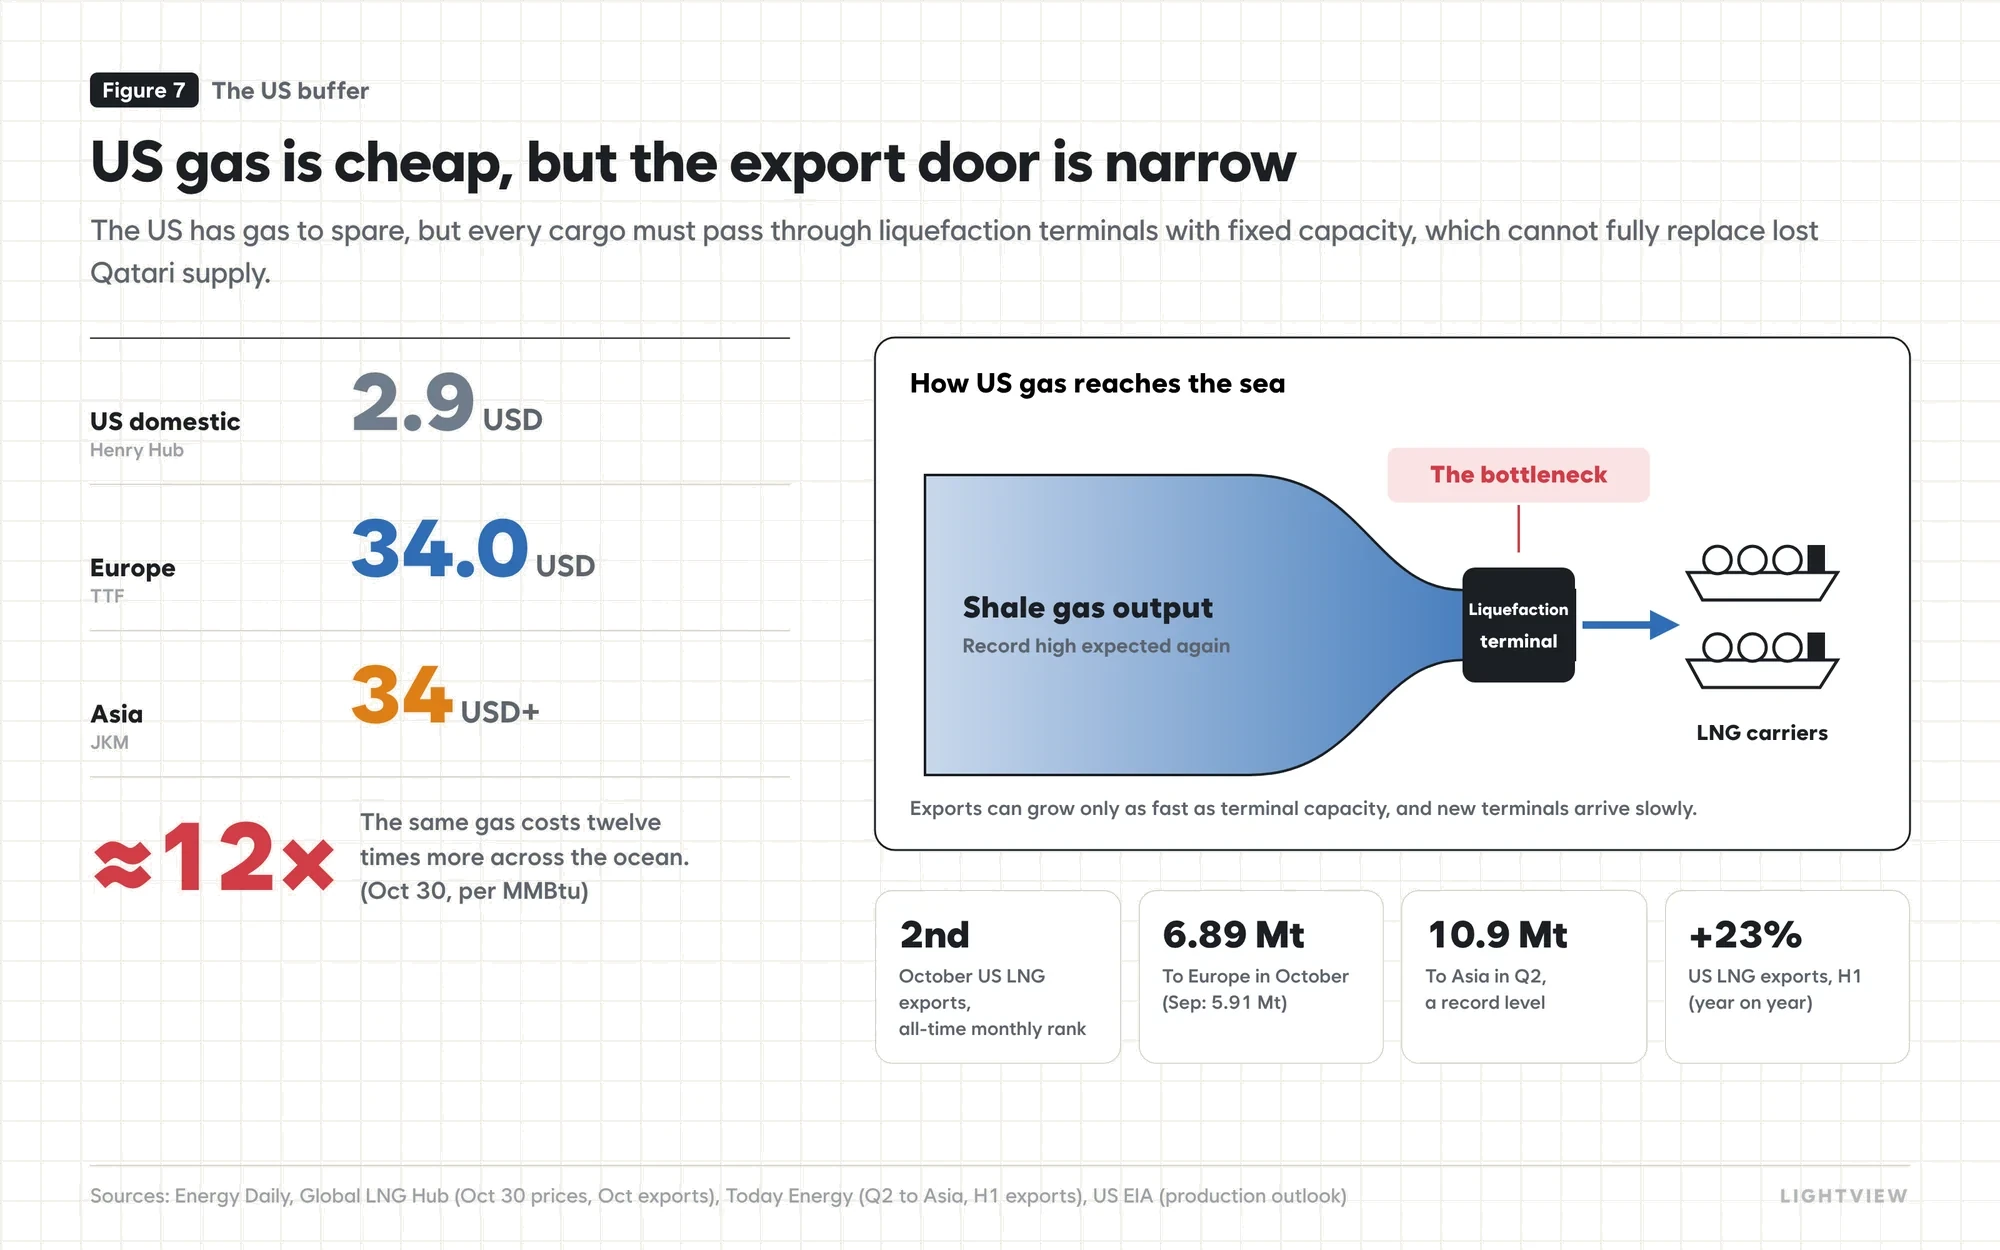
The bottleneck is liquefaction. To travel by ship, gas must be cooled to minus 162°C and turned into liquid, and US liquefaction terminals were already running close to full capacity by spring. With Qatar's absence dragging on and Europe's extra demand arriving in the second half, there was no spare capacity left, and although new terminals are coming online one by one, they cannot absorb an additional 2.5 million tonnes a month within a few months. The nearly twelvefold gap between $3 at home and $34 abroad is, in effect, the size of this bottleneck.
5Korea: A Bill Being Deferred
Higher LNG prices driven by Europe will inevitably reach Korea. Some argue that the impact will be limited because most supply comes under long-term contracts, but that view fails to separate volume from price.
About 80% of Korea's LNG imports are covered by long-term contracts. These contracts secure stable volumes, but their prices are usually indexed to market or oil prices, and Korea now has to replace blocked Qatari volumes with more expensive cargoes from elsewhere. The lack of large underground storage like Europe's adds to the burden of winter procurement.
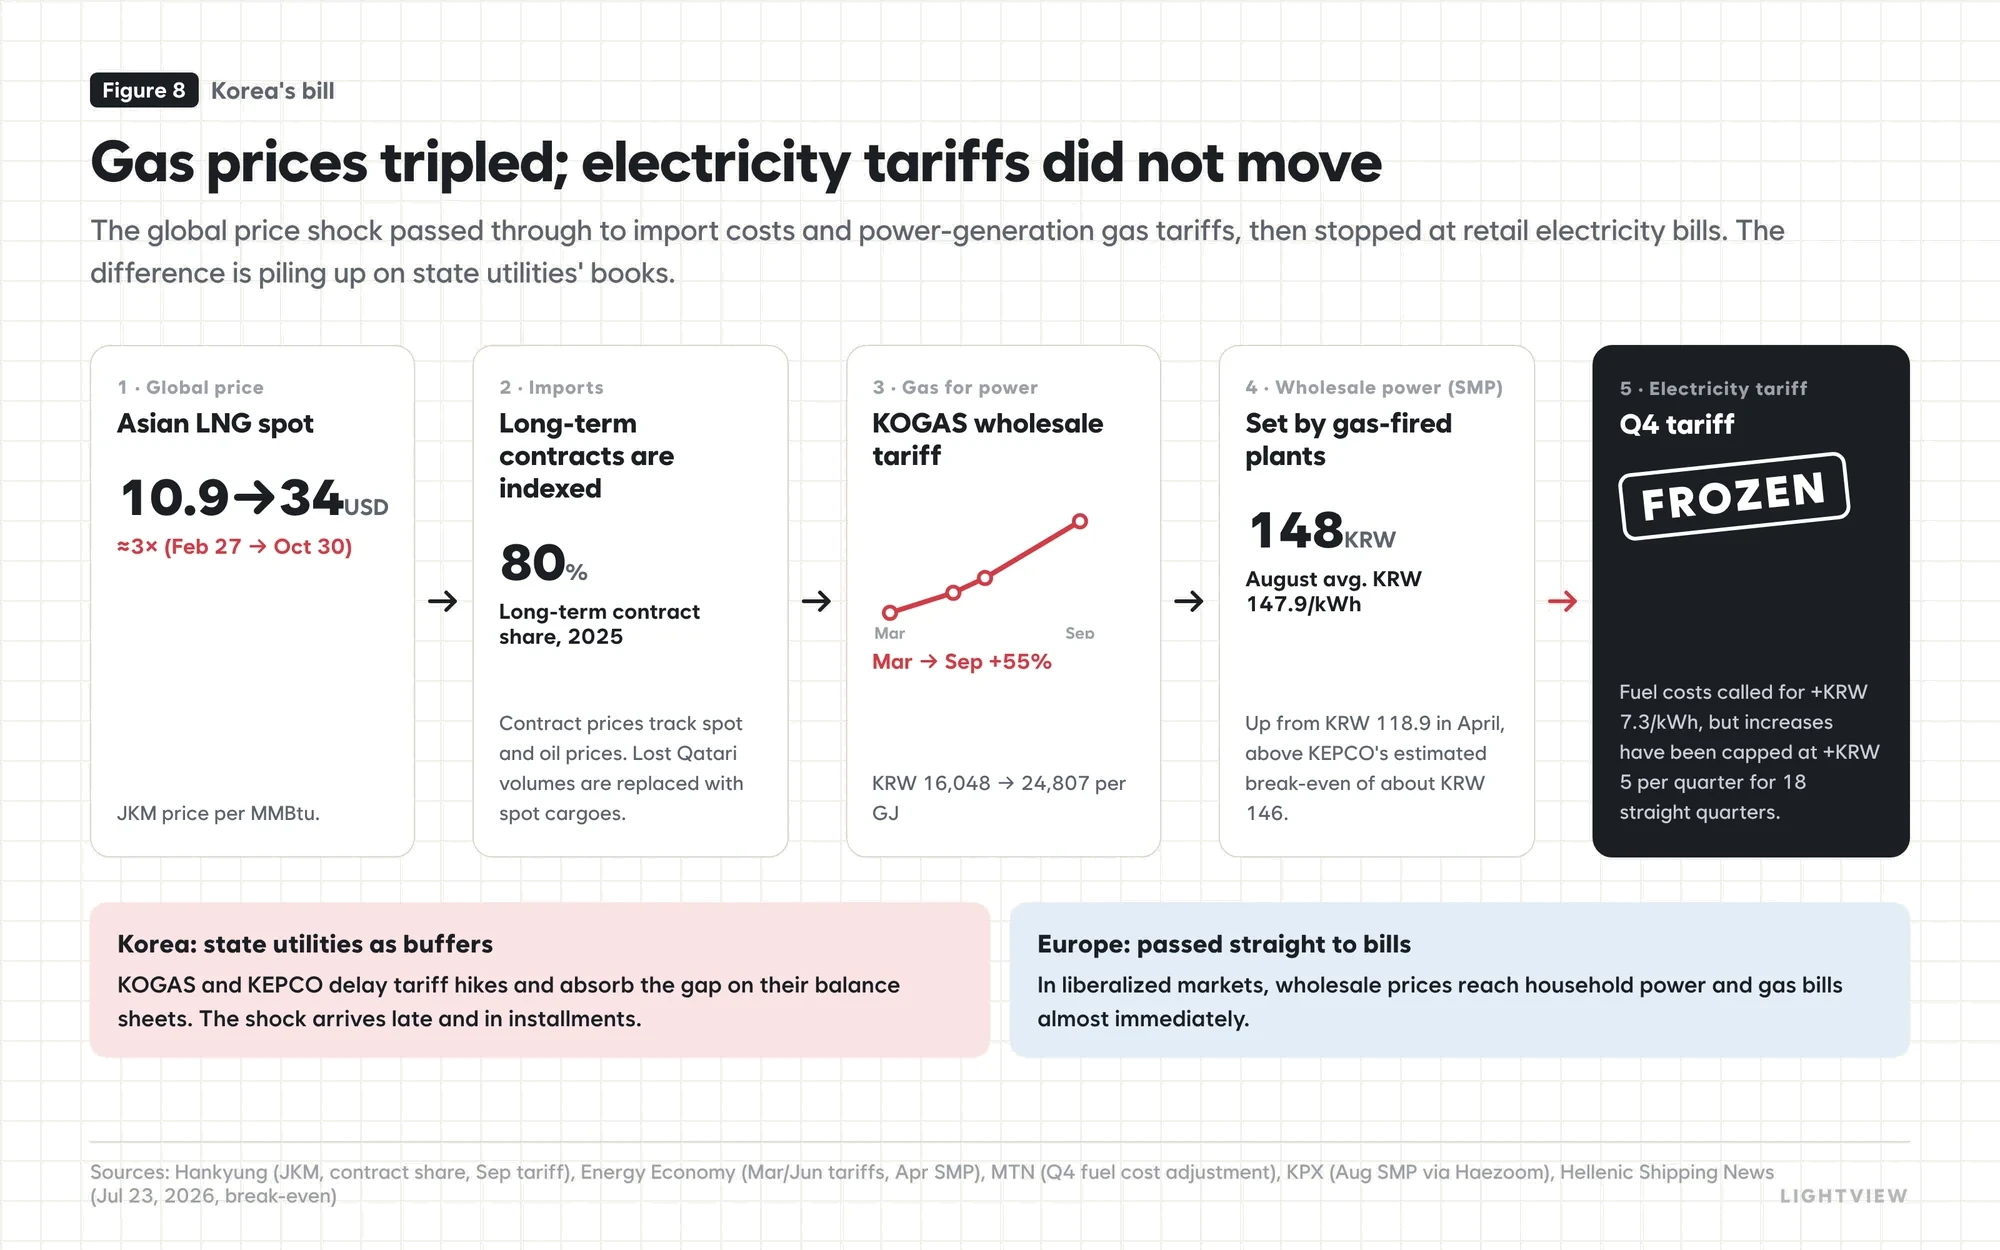
The price shock has already travelled halfway down the supply chain. The tariff KOGAS charges power generators for gas has risen 55% since March, and the wholesale power price (SMP) averaged KRW 147.9 per kWh in August, above KEPCO's estimated break-even of about KRW 146. Yet electricity tariffs were frozen for the fourth quarter: reflecting higher fuel costs would have required an increase of KRW 7.3 per kWh, but quarterly hikes have been capped at KRW 5 for 18 consecutive quarters.
Unlike Europe, where wholesale prices pass relatively quickly to consumers, Korea relies on state utilities to absorb the shock. Tariff freezes can delay the impact for now, but the cost is piling up as debt at KOGAS and KEPCO and will, in one form or another, eventually come due.
6Scenarios to Next Spring
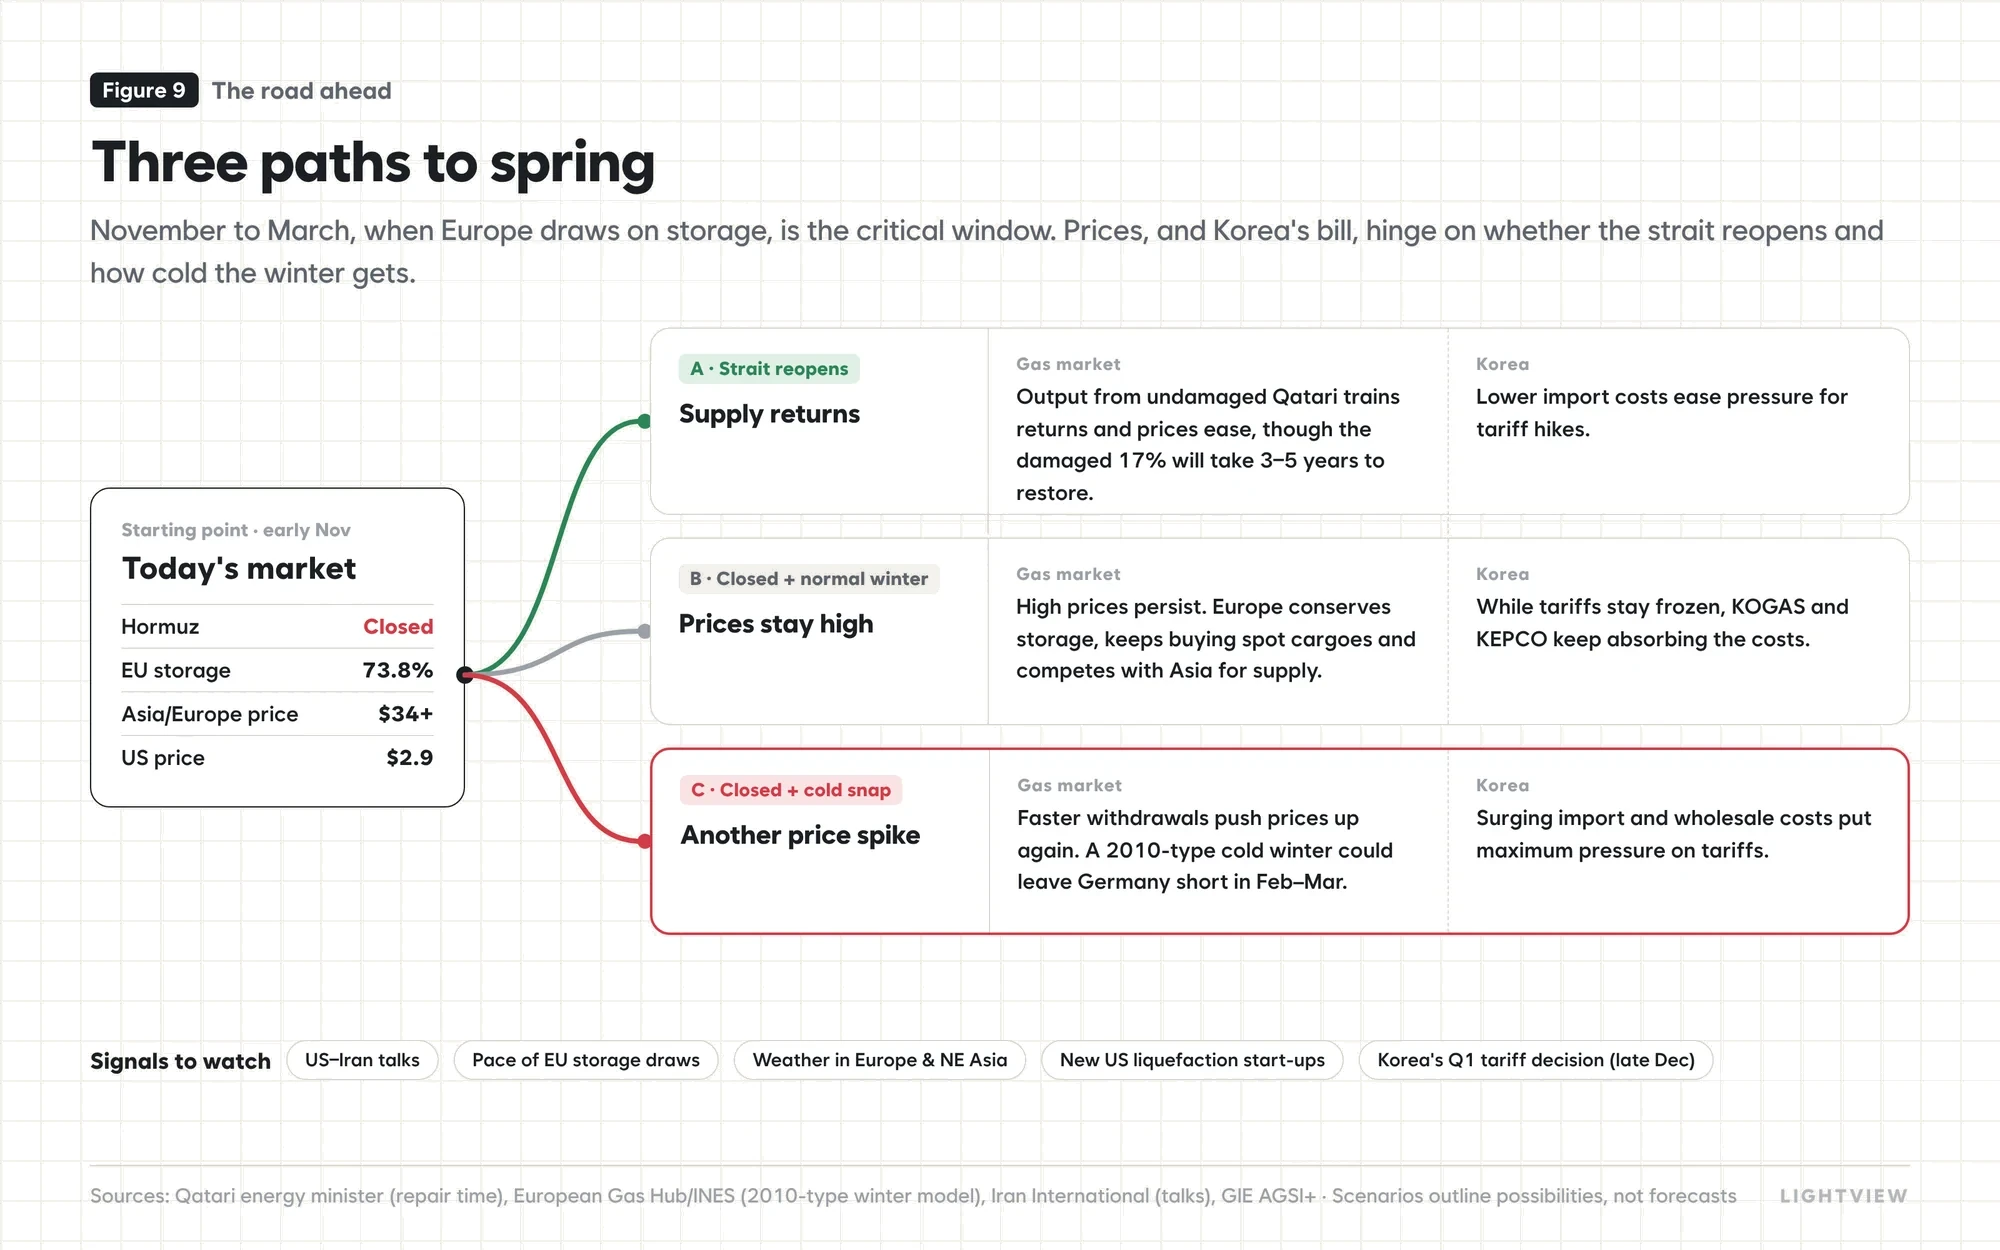
The direction of prices is likely to depend on two variables: whether the Strait of Hormuz reopens and how cold this winter turns out to be. Of the three scenarios, only A, in which the strait reopens, points to a clear decline in prices, and even then the damaged Qatari facilities will take three to five years to repair, while Europe's winter spot buying is likely to continue until March regardless of the strait. Taken together, high LNG prices are expected to persist until next spring.
Impact by sector
| Sector | If high prices last until spring | If the strait reopens early |
|---|---|---|
| LNG carriers / shipbuilding | More long-haul voyages, such as US to Asia, raise vessel demand | Shipping demand returns to normal |
| KOGAS | Unrecovered costs keep accumulating | Cost burden eases |
| KEPCO / power | Growing burden from unreflected fuel costs | Fuel cost burden eases |
| US LNG exporters | Wider domestic–overseas spread lifts margins | Spread narrows |
| Coal power | Expensive gas may lift demand for coal-fired power | Effect fades |
Whether the Strait of Hormuz reopens remains the single biggest variable, but it is not the only factor that will move LNG prices this winter. How quickly Europe's storage drains and how harsh the winter proves to be matter just as much, so it is worth tracking the EU's weekly storage data alongside news from the strait.
+Glossary and Sources
Glossary
- World Bank / IMF primary commodity prices (LNG Asia, Europe and US monthly averages) — FRED PNGASJPUSDM, PNGASEUUSDM, PNGASUSUSDM; FIPI monthly reports (Jan, Mar, Apr)
- Hankyung, Sep 27, 2026 · Energy Daily, Nov 3, 2026 · Global LNG Hub weekly prices, Nov 2, 2026
- IEA, Strait of Hormuz Factsheet (Feb 2026) · Energy Economy, May 29, 2026 · Today Energy, Sep 28, 2026 · Wikipedia, 2026 Strait of Hormuz crisis; 2026 Iranian strikes on Qatar · Iran International, Nov 2, 2026
- Reuters (via Gas Processing News), "US exporters are plugging a Qatar-sized LNG supply hole – for now," Apr 2026 · NGI, "U.S. LNG Faces Limits Replacing Lost Qatari Supply," Apr 27, 2026; "Asia Leads Global LNG Demand Destruction," Apr 28, 2026
- GIE AGSI+ (via Voltstack, Nov 4, 2026; Vantage Energies month-end data; ENGIE EnergyScan; gasspeicher.app)
- Argus, Jun 4, 2026; Jun 25, 2025; Jun 24, 2025 · European Gas Hub (INES scenarios), Jul 15, 2026 · Il Post, Sep 11, 2026 · CRE Deliberation 2018-069 · Columbia CGEP, Apr 23, 2026 · GeoERA · US EIA · Wikipedia, Natural gas storage
- Energy Economy, Jan 28, 2026 · KPX SMP (Haezoom monthly summary, Aug 2026) · Hellenic Shipping News, Jul 23, 2026 · MTN, Sep 21, 2026 · Newsis, Mar 26, 2026
Prices
Supply and the strait
European storage
Korea
This column's topic and analytical direction are set by the editor, who reviews and revises it before publication. AI tools were used for research, drafting and infographics, and every figure was checked against its source.